
Turn on suggestions
Auto-suggest helps you quickly narrow down your search results by suggesting possible matches as you type.
Showing results for
Turn on suggestions
Auto-suggest helps you quickly narrow down your search results by suggesting possible matches as you type.
Showing results for
Community Tip - You can change your system assigned username to something more personal in your community settings. X
Options
- Subscribe to RSS Feed
- Mark Topic as New
- Mark Topic as Read
- Float this Topic for Current User
- Bookmark
- Subscribe
- Mute
- Printer Friendly Page
The Weibull Distribution Function in Reliability Statistics
Apr 09, 2013
09:46 AM
- Mark as New
- Bookmark
- Subscribe
- Mute
- Subscribe to RSS Feed
- Permalink
- Notify Moderator
Apr 09, 2013
09:46 AM
The Weibull Distribution Function in Reliability Statistics
created by Piet Watte
Providing Examples from the Lighting Industry
- Creates a 2 parameter Weibull distribution and shows how to use the Weibull distribution function and other derived functions in reliability studies
- Applicable in mechanical engineering and mathematics, specifically with reliability studies and for the lighting industry
- Performs using Weibull cumulative distribution function, reliability data, logarithmic plot, Weibull distribution density function, failure rate function, bathtub curve, standard deviation, etc.
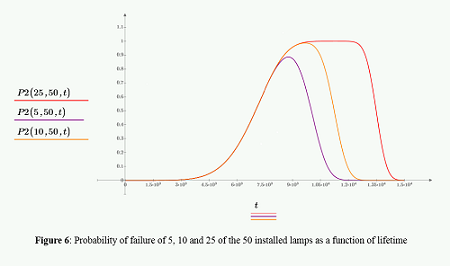
This worksheet using PTC Mathcad shows you how to define a 2-parameter Weibull distribution and shows you how the distribution can be influenced by scale and shape parameters. The worksheet shows you how to create the corresponding Weibull distribution density function along with plots which can show you the probability that products with a particular life are still operating and the failure rate of the product. The survival function and failure rate function (the 'bathtub' curve) can be also be derived. All these curves are then plotted. You can then interpret these curves in a number of ways. This worksheet looks at and answers:
- What is the probability that products, having a Weibull distribution density function as described, operate more than 2 years without failure?
- What fraction of the products that have survived 1 year of operation, will fail in year 2?
You can calculate probabilities of parts lasting time 't' without failure. A related calculation is the average life. We can also apply the mixture rule to calculate life-time of parts under multiple failure modes. After you are shown how to do these things, the worksheet provides you with two practical, real life cases which involve finding optimum lighting solutions, a common problem in the lighting industry. All data, formulas, calculations, solutions, plots, graphs, images, and notation are provided to help you in finding your own solutions.
Download and explore this worksheet yourself! You can download a free lifetime copy of PTC Mathcad Express and get 30 days of full functionality.
Labels:
0 REPLIES 0

