
Turn on suggestions
Auto-suggest helps you quickly narrow down your search results by suggesting possible matches as you type.
Showing results for
Turn on suggestions
Auto-suggest helps you quickly narrow down your search results by suggesting possible matches as you type.
Showing results for
Community Tip - Did you get called away in the middle of writing a post? Don't worry you can find your unfinished post later in the Drafts section of your profile page. X
Options
- Subscribe to RSS Feed
- Mark Topic as New
- Mark Topic as Read
- Float this Topic for Current User
- Bookmark
- Subscribe
- Mute
- Printer Friendly Page
Gaussian Probability Distribution in Mathcad
Apr 10, 2013
08:46 AM
- Mark as New
- Bookmark
- Subscribe
- Mute
- Subscribe to RSS Feed
- Permalink
- Notify Moderator
Apr 10, 2013
08:46 AM
Gaussian Probability Distribution in Mathcad
By Steven D'Ambrosio
The Behavior of the Gaussian Probability Density Function
- Visualizes and calculates the behavior of the bivariate Gaussian probability density function
- Discusses probability density and distribution, random variables, variance, and correlation
- Uses surface plots, contour plots, 3D plots, numerical integration, the central limit theorem, and coordinate transformations
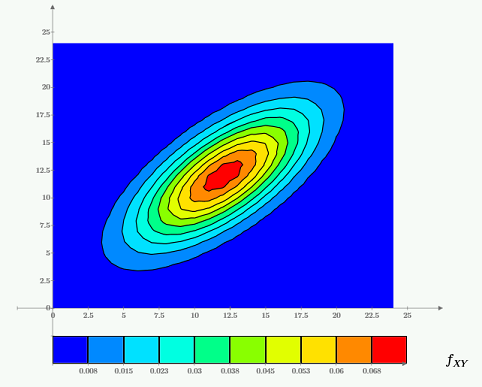
This PTC Mathcad worksheet walks you through an example of two random variables with joint density. It then visualizes the density function via surface and contour plots, and calculates the probability of an event.
The sample data used as an example compares the height and weight of students in a classroom to see if height and weight are positively correlated. The PDF shows you how to calculate the mean, variance, and correlation coefficient using PTC Mathcad software. It uses coordinate transformation to plot the data of interest with a constant density curve, in this case an ellipse. A description of the theory and relevant topics are discussed and equations, formulas, graphs, examples, and solutions are all provided in an instructional manner.
Download and explore this worksheet yourself! You can download a free lifetime copy of PTC Mathcad Express and get 30 days of full functionality.
Labels:
- Labels:
-
Statistics_Analysis
0 REPLIES 0

