
Turn on suggestions
Auto-suggest helps you quickly narrow down your search results by suggesting possible matches as you type.
Showing results for
Turn on suggestions
Auto-suggest helps you quickly narrow down your search results by suggesting possible matches as you type.
Showing results for
Options
- Subscribe to RSS Feed
- Mark Topic as New
- Mark Topic as Read
- Float this Topic for Current User
- Bookmark
- Subscribe
- Mute
- Printer Friendly Page
Manufacturing Performance Curves in Mathcad
Jun 10, 2013
08:13 AM
- Mark as New
- Bookmark
- Subscribe
- Mute
- Subscribe to RSS Feed
- Permalink
- Notify Moderator
Jun 10, 2013
08:13 AM
Manufacturing Performance Curves in Mathcad
by Mathcad Staff
About this worksheet:
- Plots performance curves (acceptance probability, average outgoing quality, and average total inspection) in a manufacturing process
- Used in a manufacturing application but the analysis can be applied in other fields
- Implements equations for the three aforementioned performance curves
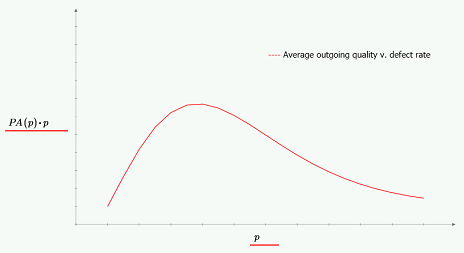
This worksheet using PTC Mathcad discusses how the output of a manufacturing process can be sampled to control the quality of the items shipped and how this sampling can be performed by plotting three performance curves. These curves include the lot acceptance probability, the average outgoing quality, and the average total inspection. The operating characteristic curve shows the probability that the lot will be accepted, the average outgoing quality measures the average fraction of defectives in the shipped product, and the average total inspection is the average number of items in each lot that are inspected.
With a given sample size and acceptance criterion you can use a Poisson distribution for defects to calculate the probability of acceptance, average outgoing quality (AOQ), and average total inspection. The same can be repeated using a hypergeometric distribution for defects.
This worksheet shows how you can generate and plot these three standard performance curves using PTC Mathcad software. This worksheet also shows you how to generate the operating characteristic curve using PTC Mathcad.
Download and explore this worksheet yourself! You can download a free lifetime copy of PTC Mathcad Express and get 30 days of full functionality.
Labels:
- Labels:
-
Statistics_Analysis
0 REPLIES 0

