
Turn on suggestions
Auto-suggest helps you quickly narrow down your search results by suggesting possible matches as you type.
Showing results for
Turn on suggestions
Auto-suggest helps you quickly narrow down your search results by suggesting possible matches as you type.
Showing results for
Community Tip - You can change your system assigned username to something more personal in your community settings. X
Options
- Subscribe to RSS Feed
- Mark Topic as New
- Mark Topic as Read
- Float this Topic for Current User
- Bookmark
- Subscribe
- Mute
- Printer Friendly Page
Random Walks in PTC Mathcad
Jun 10, 2013
09:21 AM
- Mark as New
- Bookmark
- Subscribe
- Mute
- Subscribe to RSS Feed
- Permalink
- Notify Moderator
Jun 10, 2013
09:21 AM
Random Walks in PTC Mathcad
By Frank Purcell
About this worksheet:
- Simulates a random walk and visualizes it
- Academic in nature but random walks are also applicable in other fields
- Performs using "runif" function, graphing, histograms, cumulative distribution plots, standard deviation, etc
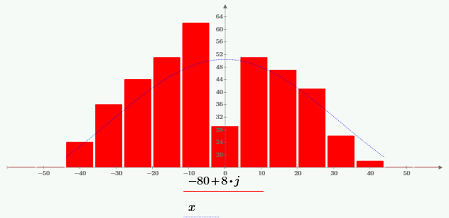
This worksheet using PTC Mathcad shows you how to simulate a random walk and visualize it through the use of graphs and charts. To begin, you are shown how to use the 'runif' to generate an array of +1 or -1. You can plot this to see how the number of "steps" affects the distance away from the starting point. You can repeat this process over a couple hundred times using walks and then plot a histogram to see the distribution of the endpoints.
You can also repeat in 2D and plot the walk on the Cartesian coordinate. The distribution of endpoints can be modeled with a normal distribution with a standard deviation related to the number of steps. As the number of steps approaches infinity, the arcsine law can be used to express the probability that the fraction of the walk spent on the positive side is less than some variable 't'.
All data, charts, graphs, solutions, and notation is included to help you in creating and viewing your own random simulations.
Download and explore this worksheet yourself! You can download a free lifetime copy of PTC Mathcad Express and get 30 days of full functionality.
Labels:
- Labels:
-
Statistics_Analysis
0 REPLIES 0

