Turn on suggestions
Auto-suggest helps you quickly narrow down your search results by suggesting possible matches as you type.
Showing results for
Turn on suggestions
Auto-suggest helps you quickly narrow down your search results by suggesting possible matches as you type.
Showing results for
Community Tip - Need to share some code when posting a question or reply? Make sure to use the "Insert code sample" menu option. Learn more! X
- Community
- PLM
- Windchill Discussions
- Query Builder for Live Project Status Reports (NPI...
Options
- Subscribe to RSS Feed
- Mark Topic as New
- Mark Topic as Read
- Float this Topic for Current User
- Bookmark
- Subscribe
- Mute
- Printer Friendly Page
Query Builder for Live Project Status Reports (NPI, Large Engineering Change, etc.)
Aug 08, 2014
04:32 PM
- Mark as New
- Bookmark
- Subscribe
- Mute
- Subscribe to RSS Feed
- Permalink
- Notify Moderator
Aug 08, 2014
04:32 PM
Query Builder for Live Project Status Reports (NPI, Large Engineering Change, etc.)
Situation:
- We are doing a large new Product Introcution (NPI) project that is converting an existing, large, unlinked Creo / WTPart product structure into a linked structure that uses Options & Variants, Options Modeler, and MPMLink.
- Our configurable product structure is undergoing a design review and quality assurance process from the bottom up by configuration items that we call, "Config Assemblies."
- Each config assembly has work that we model as a "Change Task" that includes reviewing, testing, and approving that configuraiton and it related objects.
- Closely related tasks are on the same Change Notice.
- All Change Notices in the project are linked to a single Change Request that ties the project together.
- We have a project plan with need dates for each of the tasks.
- Our resource contraints and task dependencies result in a plan with estimated start and no-later than "Need Dates" for the approval of each task in order to achieve our deadline.
- In our Windchill implementation and business process, of our Windchill part, CAD, and document objects "Release" on Change Notices as Resulting Objects on Change Tasks.
Problem: How can we use Windchill to present daily project status so we know what is done, what is not done yet, what is done early, and what is late?
Solution: Query Builder Rocks! Using Query Builder and some tricks that make it all come together, we have live reports, like the one below, with supporting graphs that we run every day at 5 PM to track status. Everything in this post is out of the box except for "light types" that we have defined using the Type and Attribute Manager. None of graphs or reports are customized. This is possible for any business admin in Windchill 10.1 or later (and maybe earlier) who can set these up without ever requiring a code change or system restart.
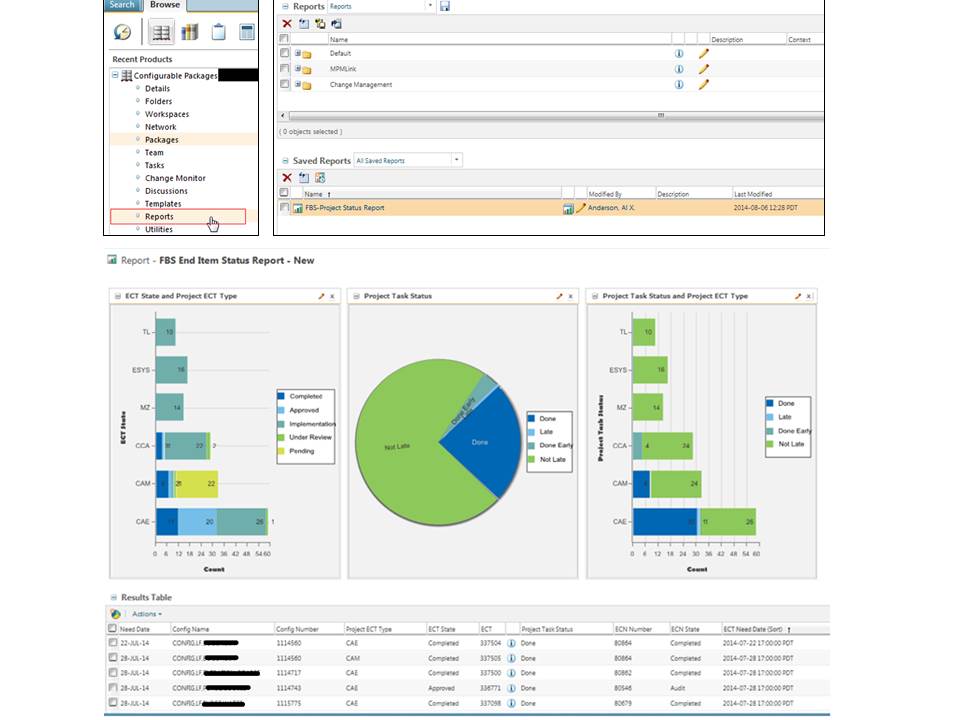
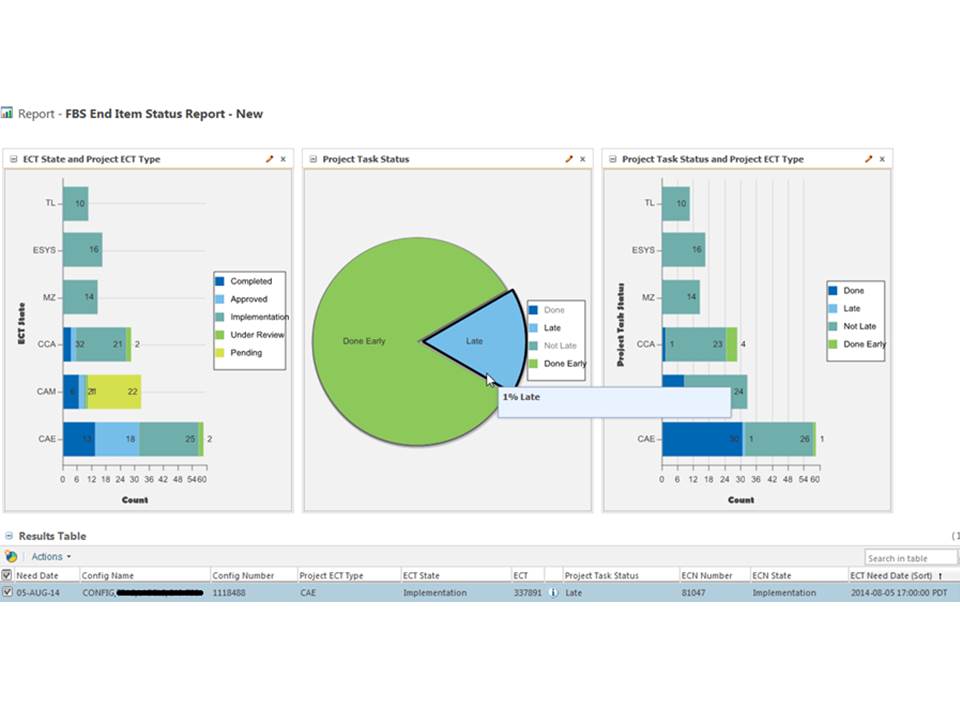
We can export this to excel using the actions drop down, but since this is pre-sorted in Need Date Order, and I can easily manipulate the charts by clicking on the elements that I want to either hide (by clicking on the legend item) or filter the Results Table (by clicking on one of the elements inside of a chart), I don't need excel. Also, I can use "Find in Table" to additionally filter items to focus on specific items of interest. I can also click the information icon to look at the details of any task in a new window, as well. For example, in the report, above, by clicking on the "Done" and "Not Late" items in the legend of the pie chart, the report auto-hides those items focusing on the remaining "Done Early" and "Late" items. By then clicking directly on the "Late" slide of the pie, the "Results Table" filters to ONLY show the Late Tasks.
Here is how we did this "out of the box."
To start, you have to know the basic object model for changes and linked items. Here is a picture.
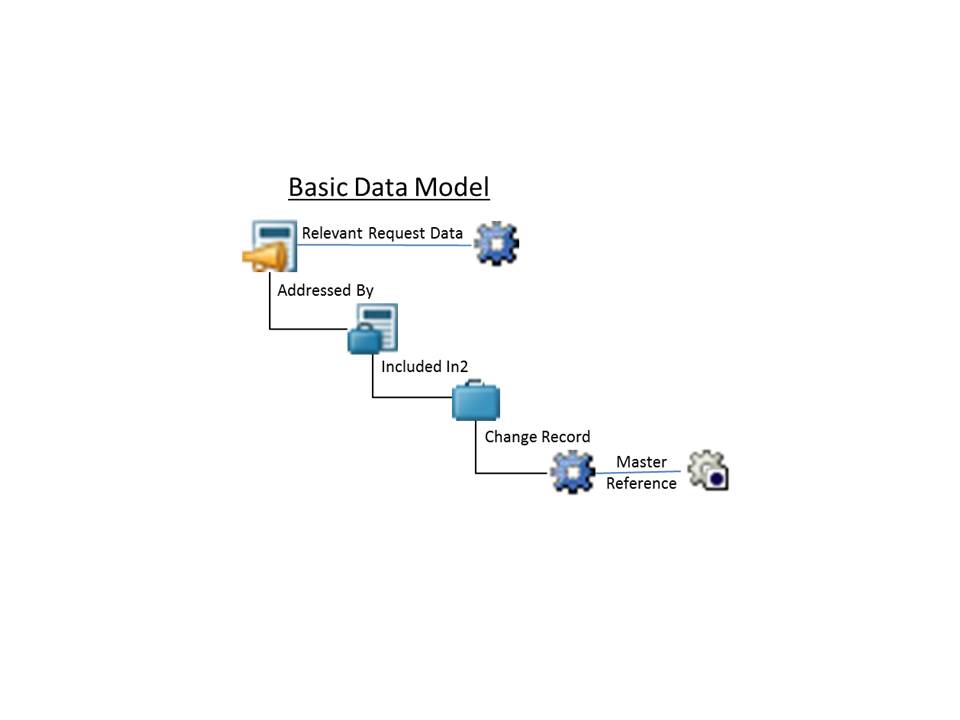
We then set up a master Change Request (ECR) with multiple Change Notices (ECNs) that each have Change Tasks (ECTs). On each ECT we have Resulting Objects (CAD, Parts, Documents) that need to be approved and released together. However, not all tasks are equal since some tasks represent major configuration items, while others are supporting tasks. Our project plan tracks configuration items by part number, and we want to track only those tasks, not all tasks on all of the ECNs. Therefore, we use query builder to only show ECTs associated with our master ECR that have Part Numbers in our project plan by copying that comma-sparated list of part numbers into an "IN" criteria.
We also have different kinds of configuration items. We indicated their category with an ECT Name pre-fix. This is easier than using light types or attributes because the same config item might change its category in our project plan without changing its light type or attributes. These categories aligns tasks with internal departments, so they are really for status and project management. For example, an ECT with the prefix "CCA-" is a "Controls Config Assembly", "CAE-" is a Config Assembly (Engineering)", a "CAM" is a "Config Assembly (Manufacturing)", etc. In query builder we use functions to parse out those prefixes for reporting and graphing.
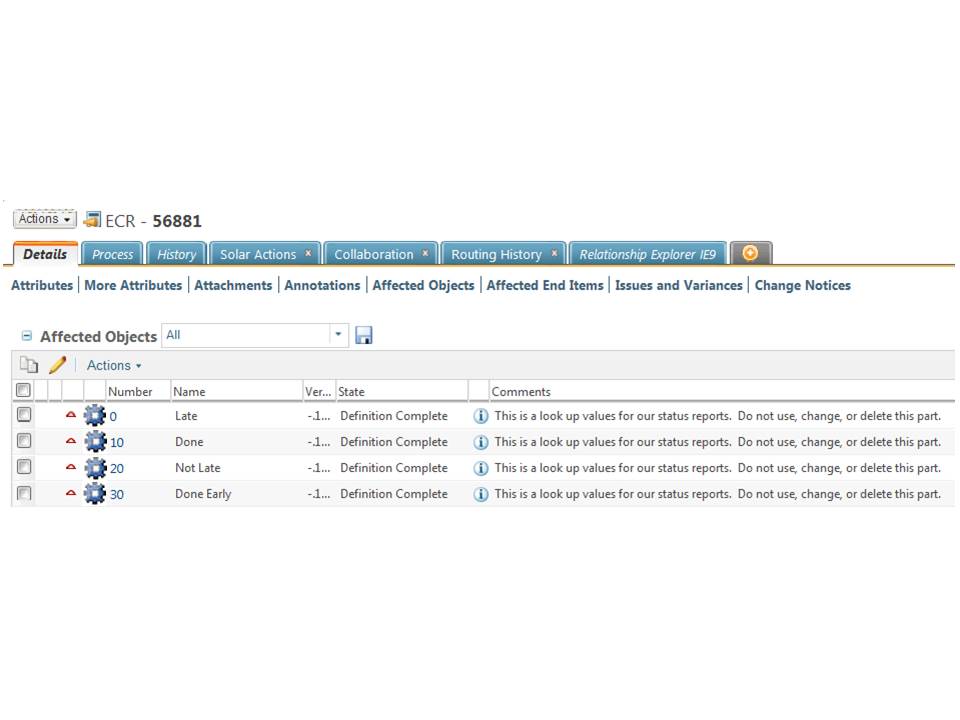
Finally, I wanted to show ECTs as "Late", "Not Late", "Done Early", or "Done". I did not want to customize. I did not want to use numbers (i.e. 0 = On Time). I wanted "done" be be either an ECT in the state of "Completed" or "Approved". To achieve this, I used a series of functions and some "look up" parts linked to the master ECR to calcuate if an ECT is ahead or behind schedule, and then look up that numeric result from the linked "look up" parts on the ECR to show their part "Name" as "Late", "Not Late", "Done Early", or "Done". Below is a picture of these look up parts. They will make more sense later when you see how we use them.
Here is the step by step process for setting this all up in query builder.
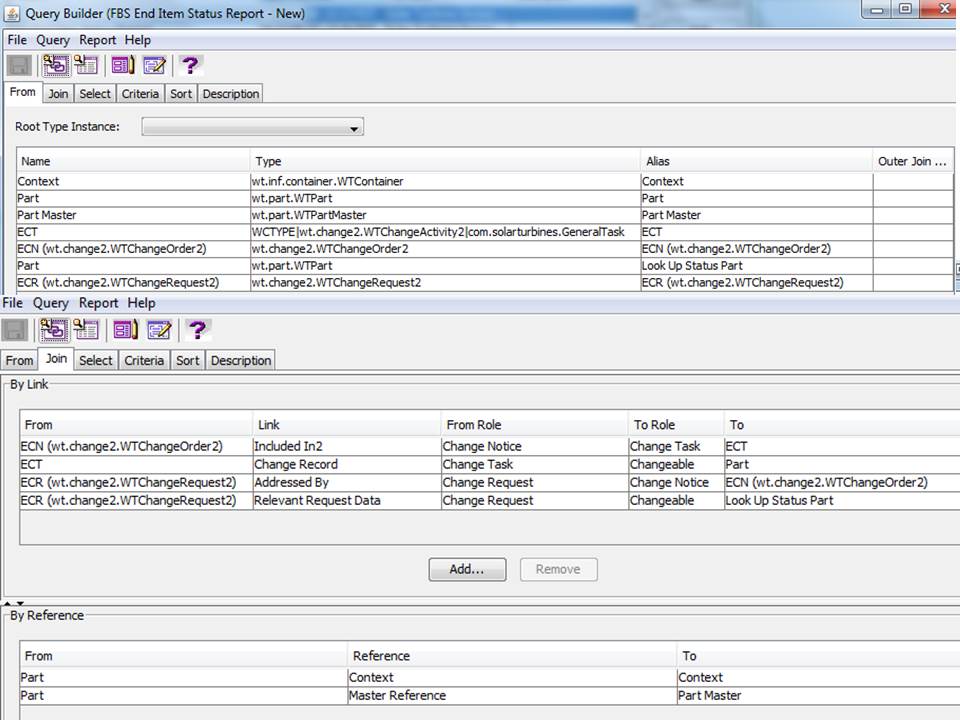
FROM and JOIN
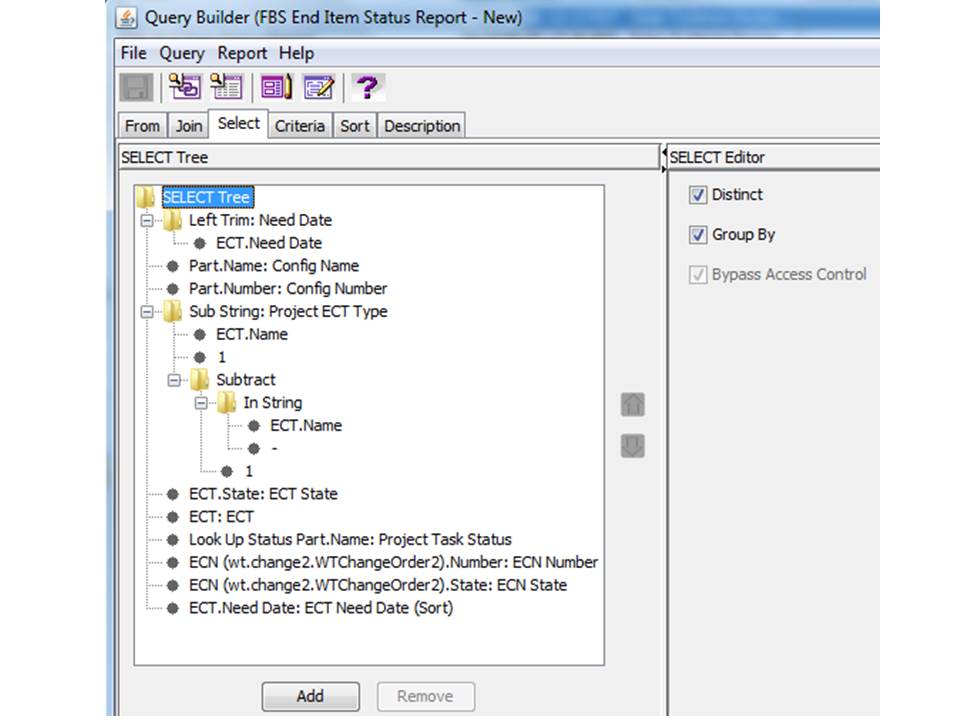
SELECT - Notice the use of "In String" to parse the ECT Name Prefixed into a column called "ECT Type" for reports and graphs. Also notice the use of "Left Trim" to present the dates in the report without the annoying MM:HH:YYYY TIM suffix that a date columns typically has. Also notice the "ECT Need Date (Sort)" column, which is needed because you cannot sort accurately on a column that uses LEFT TRIM on a date.
Note the use of "Distinct" and "Group By" for the "SELECT Tree."
Also notice the "Look Up Status Part.Name" that allows me to show "Late" or other text values for the number returned by the subselect, defined, below.
CRITERIA - Notice the Part Master.Number IN clause that lists ONLY the part numbers of our "config items" that we want to report on. This will only show the ECTs that are linked to the config items in our project plans, not the other supporting ECTs.
Also notice the "Subselect" for the "Look Up Status Part.Number" that allows me to
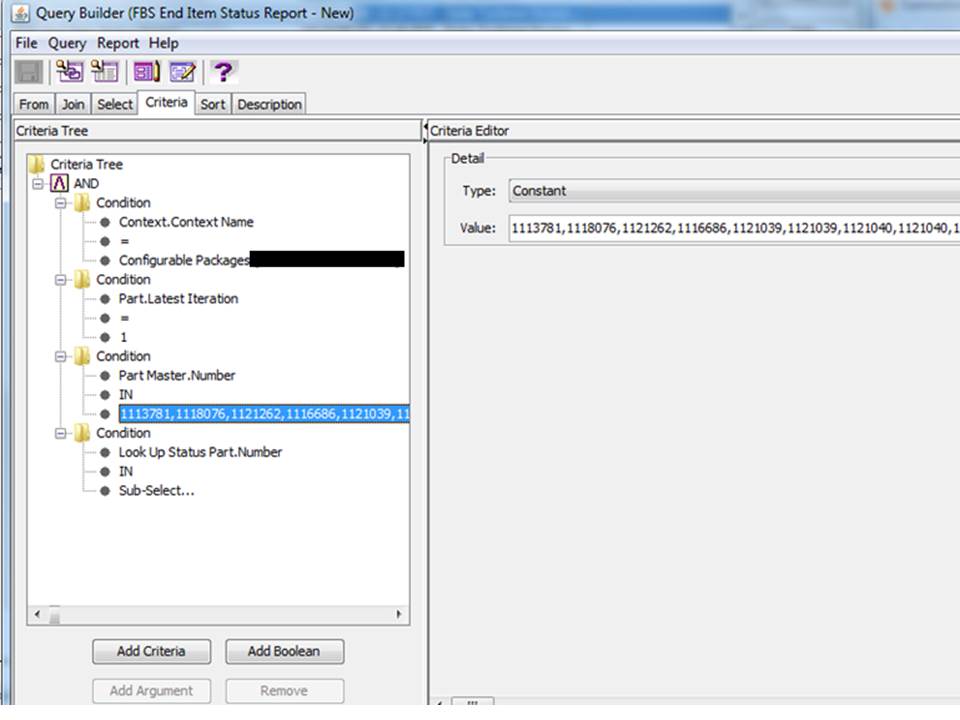
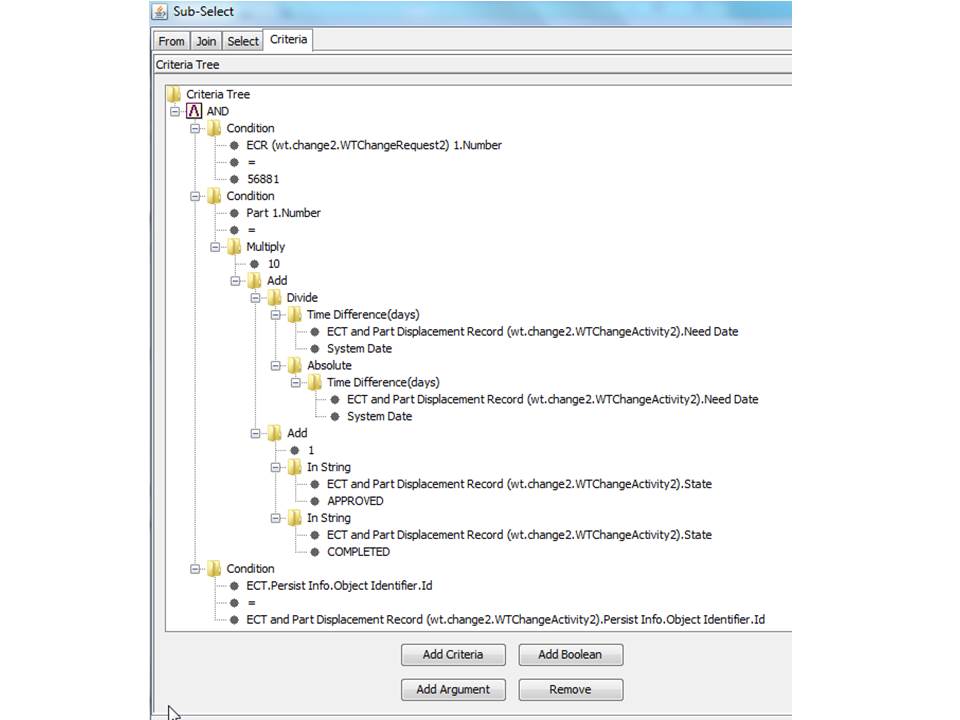
Sub-Select... - This is the really fun part! This is how we figure out if something is late or not.
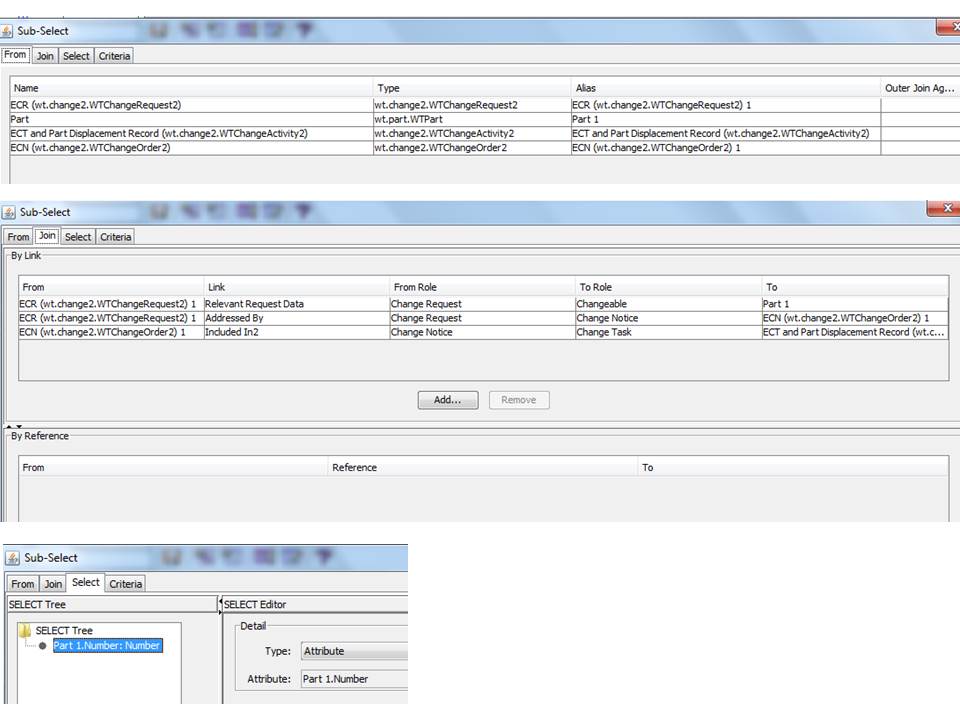
This math, below, reduces Need Date relative to System Date (now) to either a 1 or -1 value by the following formula.
(ECT.Need Date minus System.Date) divided by the absolute value of [ (ECT.Need Date minus System.Date) ].
We then have to know if we are "done" yet by state using In String on the states of "APPROVED" and "COMPLETED". In String returns -1 if the string is not found, and 1 if it is found. So, this formula, below, results in 1-1-1=-1, or 1+1-1=1.
The on time formula results in 0, 1, 2, or 3. I wanted to have look up part numbers that match, but in my database, 1 and 2 were used, so I arbitrarily "multiply" the results by 10 to give me Part Numbers I can use: 0, 10, 20, 30.
0 = Late
10 = Done
20 = Not Late
30 = Done Early
And yes, anything "Done Early" will eventually become just "Done" once its need date passes. This is fine with us!
That is it for the sub-select. Back to the main report...
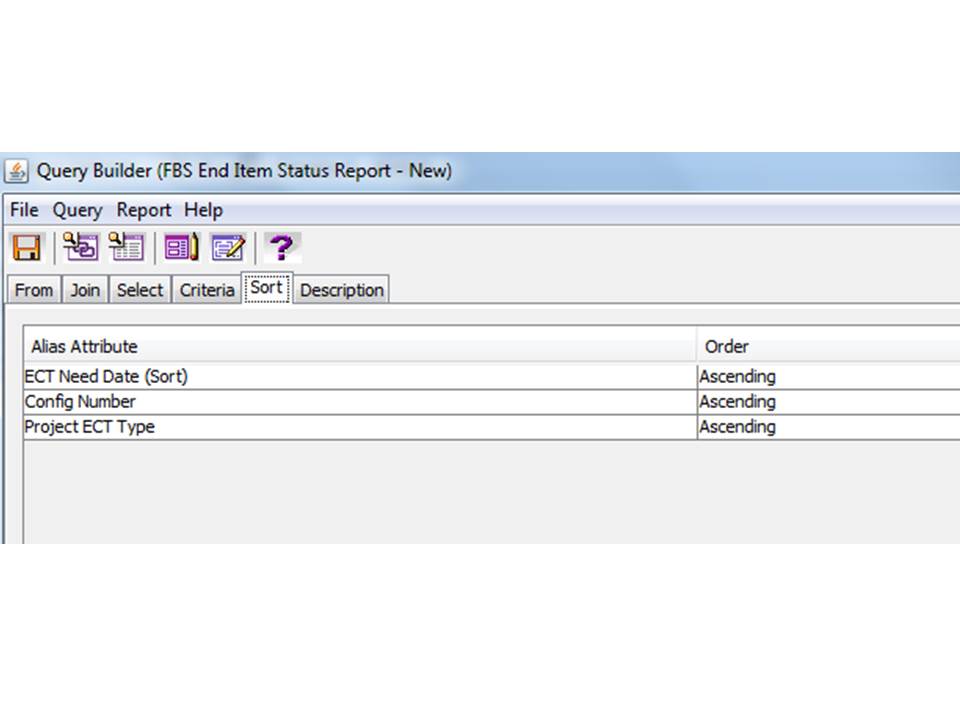
SORT - We finally short by the ECT Need Date (Sort) in Ascending (old to new) then by part number (Config Number) and then by Projectc ECT Type (the ECT Name Prefix prior to the - ).
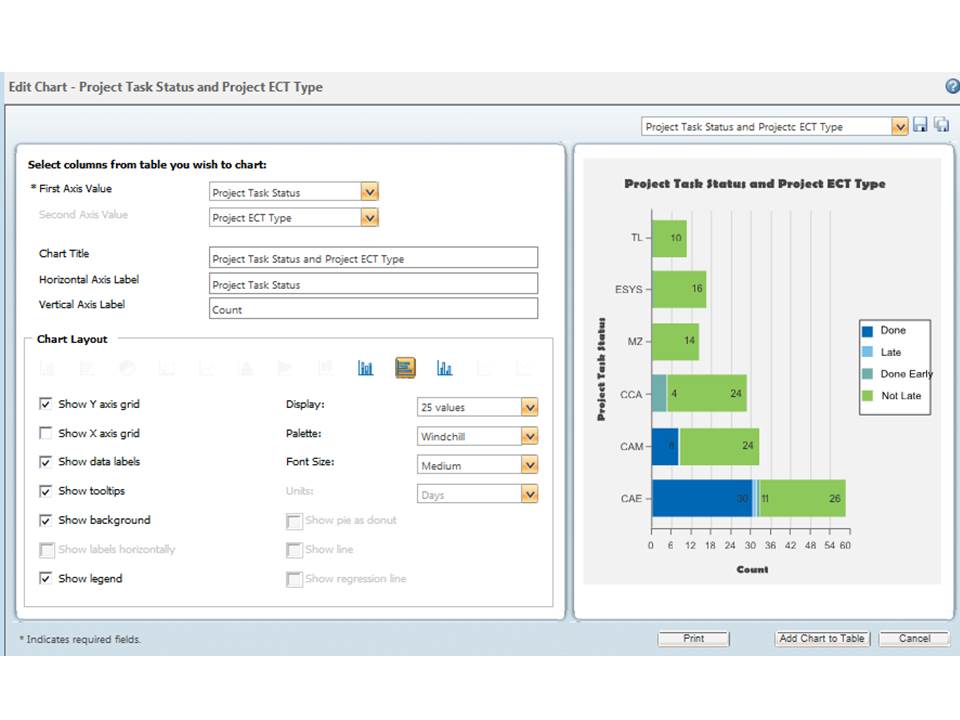
GRAPHS - Run the report, select all the columns, then build your graphs, like this.
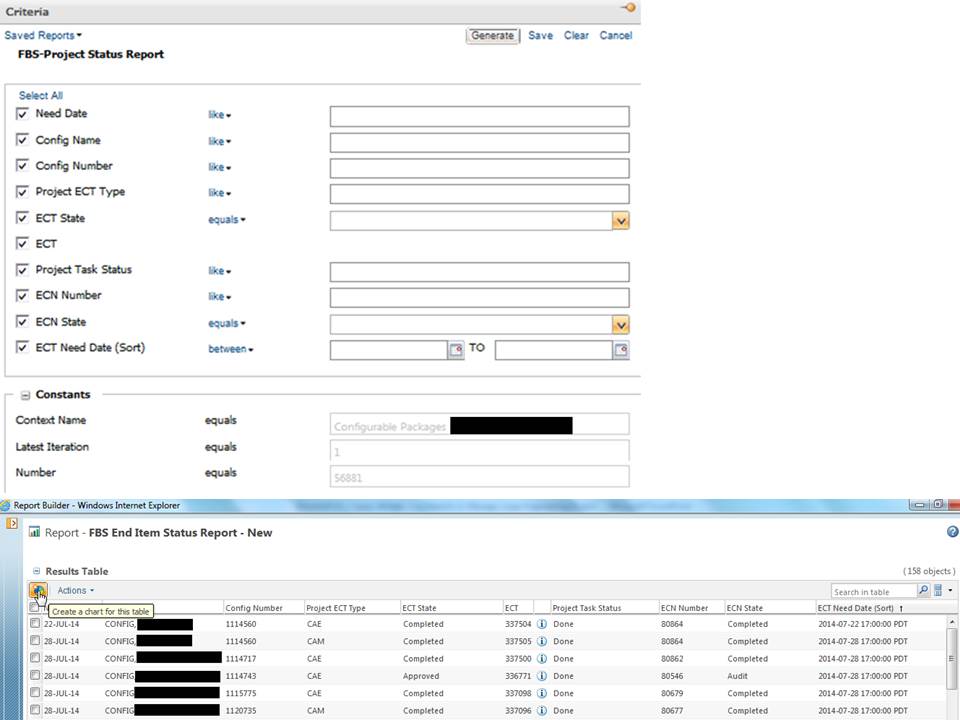
In the results, as shown above, click "Create a chart for the table" three times, once for each graph. The interface for making a graph looks like this.
When you like what you see, then Save the Report. You can then access the report from the context "Reports" link any time you want to run a fresh status report with live graphs! Here, again, is the first image from above - the fully interactive, sortable, filterable, exportable project status report.

This was fun to make. And it is very useful on our current project. We use it every day for status to see how we are doing, and what's coming up next. It does not replace MS Project, but it does help get true, live, linked status quickly without e-mails or meetings.
Regards,
Al Anderson
PLM Functional Architect
Solar Turbines Incorporated
Labels:
- Labels:
-
BOM_Platform Mgmt
3 REPLIES 3
Jun 04, 2015
10:30 AM
- Mark as New
- Bookmark
- Subscribe
- Mute
- Subscribe to RSS Feed
- Permalink
- Notify Moderator
Jun 04, 2015
10:30 AM
Hello
thank you for sharing this with us. This is a very fine article and well described methodology.
I am wondering, while you used OOTB functionalities. does it require Business Report licence or you have used what comes with PDMLink only.
Also do you know if you could get a graph that shows an accumulation.
What I mean is this.
x axis, you have for instance each day you ran the report and Y axis the number of tasks which are late.
After running the report 10 times for instance you have 10 column showing for each time the report was ran the number of tasks late. After a while you can see if your team has getting on with their task or if they lose control and have more and more task late.
The way I do it at the moment is to get a snapshot from Windchill for a given day and put the figure in Excel, So the report is like a search telling how many tasks are late for the day the search is done. and I use excel to keep the history. It would obviously be more efficient to have PDMLink do that for me.
I hope that makes sense and thanks ago for this great tutorial
Best regards
Jun 11, 2015
11:40 AM
- Mark as New
- Bookmark
- Subscribe
- Mute
- Subscribe to RSS Feed
- Permalink
- Notify Moderator
Jun 11, 2015
11:40 AM
Thank you for publishing this, Al
Sep 29, 2015
03:09 PM
- Mark as New
- Bookmark
- Subscribe
- Mute
- Subscribe to RSS Feed
- Permalink
- Notify Moderator
Sep 29, 2015
03:09 PM
Q: "..does it require Business Report licence or you have used what comes with PDMLink only."
A: Everything I have done is with out of the box PDMLink only. We do not have the Business Report capability. If we had that capability, than we could have programmers or advanced admins make much more complex reports. However, my intent was to show that even with basic, free query builder you can do a lot without a programmer.
Q: "Also do you know if you could get a graph that shows an accumulation. What I mean is this. x axis, you have for instance each day you ran the report and Y axis the number of tasks which are late. After running the report 10 times for instance you have 10 column showing for each time the report was ran the number of tasks late. After a while you can see if your team has getting on with their task or if they lose control and have more and more task late."
A: Sort of. I would not do it that way. I would show WIP and& Exit Rate by day, month or quarter, as well as inputs by the same time period and that combination will show your current cycle time as well as whether your are falling behind or getting ahead on your backlog.
Regards,
Al