
Turn on suggestions
Auto-suggest helps you quickly narrow down your search results by suggesting possible matches as you type.
Showing results for
Turn on suggestions
Auto-suggest helps you quickly narrow down your search results by suggesting possible matches as you type.
Showing results for
Community Tip - Learn all about PTC Community Badges. Engage with PTC and see how many you can earn! X
Options
- Subscribe to RSS Feed
- Mark Topic as New
- Mark Topic as Read
- Float this Topic for Current User
- Bookmark
- Subscribe
- Mute
- Printer Friendly Page
Loading Impulse Generator Data into Mathcad
Feb 10, 2013
06:36 PM
- Mark as New
- Bookmark
- Subscribe
- Mute
- Subscribe to RSS Feed
- Permalink
- Notify Moderator
Feb 10, 2013
06:36 PM
Loading Impulse Generator Data into Mathcad
Hello all,
I am trying to figure out how to go about loading data that is stored in a text file into mathcad.
My hope is to make some plots using the data, and perhaps some other calculations.
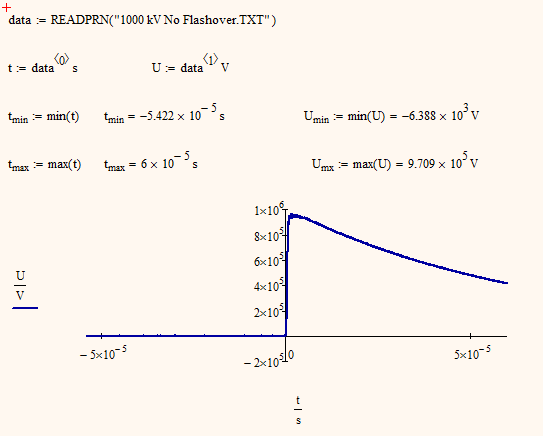
I've attached one of the data files to this thread so you can observe the format of the data. This contains data measurements from a High Voltage Impulse Generator.
Could someone show me how to do this by means of an example?
Thanks again!
Labels:
- Labels:
-
Statistics_Analysis
19 REPLIES 19
Feb 10, 2013
06:58 PM
- Mark as New
- Bookmark
- Subscribe
- Mute
- Subscribe to RSS Feed
- Permalink
- Notify Moderator
Feb 10, 2013
06:58 PM
I am trying to figure out how to go about loading data that is stored in a text file into mathcad.
No problem, if you get rid of the text lines in front of yor data:
Feb 10, 2013
08:40 PM
- Mark as New
- Bookmark
- Subscribe
- Mute
- Subscribe to RSS Feed
- Permalink
- Notify Moderator
Feb 10, 2013
08:40 PM
Werner Exinger wrote:
No problem, if you get rid of the text lines in front of yor data:
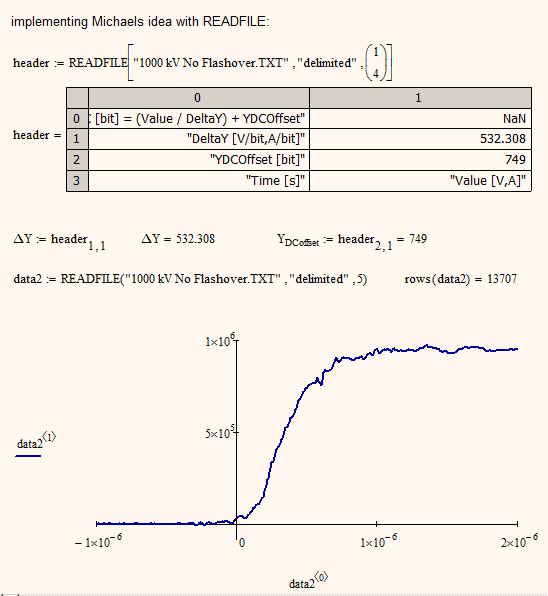
If you use READFILE(), you can tell Mathcad to skip over those header lines.
This is particularly handy with one must process multiple files with the same header format.
Feb 10, 2013
10:50 PM
- Mark as New
- Bookmark
- Subscribe
- Mute
- Subscribe to RSS Feed
- Permalink
- Notify Moderator
Feb 10, 2013
10:50 PM
 Yes, this seems to be better. At least if the posters datafiles all have the same number of header lines.
Feb 11, 2013
10:25 PM
- Mark as New
- Bookmark
- Subscribe
- Mute
- Subscribe to RSS Feed
- Permalink
- Notify Moderator
Feb 11, 2013
10:25 PM
Hello Mr. Exinger and MichaelH,
First thank you both so much for all your help!
I have taken the example Mr. Exinger has provided and modified it a little bit to better suit my needs. See the attached mathcad file for what I've got so far. I've also attached the data files for the other plots as well.
Now I want to calculate particular points corresponding to certain aspects of the data.
I can obtain the peak voltage value for a given data set by typing,
max(data1^<1>) =
but how do I figure out which particular time that point corresponds to? i.e. the time value in the other column that corresponds to that particular value within the voltage column.
Essentially, I want to figure out a bunch of times corresponding to some percentage of the peak voltage found in a given data set.
More speifically, I want to find,
- The times corresponding to 30%, 50% and 90% of the peak voltage
- And for the waveforms with "Flashovers" (i.e. the chopped waveforms) I want to figure out the time at which the waveform is "chopped". That is, when the decaying voltage begins to drastically plummit.
I figure I can store the peak voltage into a variable like x as such,
x := max(data1^<1>)
and then somehow locate the times for, 0.3*x, 0.5*x and 0.9*x. Can someone explain how this could be done?
EDIT: I have been able to achieve this using the lookup function for the peak voltage and 50% of the peak voltage, but I am getting errors for 30% and 90% of the peak voltages. Does anyone know why? Clearly it passes the 30% and 90% marks before reaching the peak. Is there a way I can find the closest value to 30% and 90% of the peak voltage? Or is it possible to interpolate between the 2 nearest points around the 30% and 90% marks? If so how?
Furthermore, how should I go about detected the chopped times? I need to figure out how to deteremine when the waveform begins to plummet and somehow extract the particular time that this occurs.
Thanks again for all your help!
Feb 12, 2013
11:17 AM
- Mark as New
- Bookmark
- Subscribe
- Mute
- Subscribe to RSS Feed
- Permalink
- Notify Moderator
Feb 12, 2013
11:17 AM
First thank you both so much for all your help!
You're welcome!
but how do I figure out which particular time that point corresponds to? i.e. the time value in the other column that corresponds to that particular value within the voltage column.
You provided the answer yourself in the worksheet - use of lookup. In Mathcad 15 lookup only works for exact match, more modifiers for lookup like "near" are only available in Mathcad Prime. So you get the error if Vmax*0.3 is not (ecaxt) in the data set. In MC15 I don't know of an out of the box solution, you would have to write your own routine to do the job.
And for the waveforms with "Flashovers" (i.e. the chopped waveforms) I want to figure out the time at which the waveform is "chopped". That is, when the decaying voltage begins to drastically plummit.
Again you will have to write your own routine to do so. First of all you will have to define what "drastically" means, e.g. how you would determine the chop time. That could be:
- when two consecutive data points have a difference larger than "limit" (10^5, ?????)
- when the first and last datapoint in a sliding window of 5 (10, 20, width) points width have a difference of larger than ????
- when the data is 50% if the peak value the second time
- .....?
Find attached an implementation of the second idea (which includes the first for windows width 2). Its very sensible about the values of limit and width so I am not sure if that would be suitable for automatic data evaluation.
Maybe a look at http://communities.ptc.com/message/194695#194695 will be helpful as there is a similar problem. The files are in Prime-format though.
Feb 12, 2013
07:20 PM
- Mark as New
- Bookmark
- Subscribe
- Mute
- Subscribe to RSS Feed
- Permalink
- Notify Moderator
Feb 12, 2013
07:20 PM
Hello Mr. Exinger,
Thank you very much for the creative routine for solving the chopping time! I read through it and it is clear what you've done. (I am still quite inexperienced in using loops in mathcad)
Can you help me come up with a simple routine for determining times corresponding to percentages of the peak voltage?
Although there may be no exact match for 30% and 90% of the peak voltage, could I somehow locate the 2 surrounding points around these values and interpolate between them to get an answer?
Is there an easier routine to get this part done?
Thanks again!
Feb 12, 2013
08:43 PM
- Mark as New
- Bookmark
- Subscribe
- Mute
- Subscribe to RSS Feed
- Permalink
- Notify Moderator
Feb 12, 2013
08:43 PM
Some different solutions come to my mind
- a routine could locate all values which are in a given range around the search value and all corresponding time values are collected in a vector. Because of noise and if the range is too big you would get probably quite a lot of time values where you would expect only one
- you could smooth your graph (via a sliding window) replacing the values with the arithmetic mean of the values in the window and then let routine 1 go over it. This will minimize those multiple nearby time values
- you can easy locate the two data points with the searched for value being in between. One simply would have to multiply (data_i - value)*(data_i+1 - value) and if that product is negative - Bingo! Only problem could be if a datapoint is exact the search value (product=0). Another question would be what time value to return - just the arithemtic mean of the two, or a linear interpolation or something better? Also because of noise in your data this would again mean that you will get a bunch of values where you would expect only one.
- .....
Find attached an implementation of the third idea. There is an additional part which looks for an exact match and I found that is was necessary not to ask for an exact match but build in kind of tolerance to get the same results as the built in lookup. Of course my lookup2 finds a lot more values.
Feb 12, 2013
10:11 PM
- Mark as New
- Bookmark
- Subscribe
- Mute
- Subscribe to RSS Feed
- Permalink
- Notify Moderator
Feb 12, 2013
10:11 PM
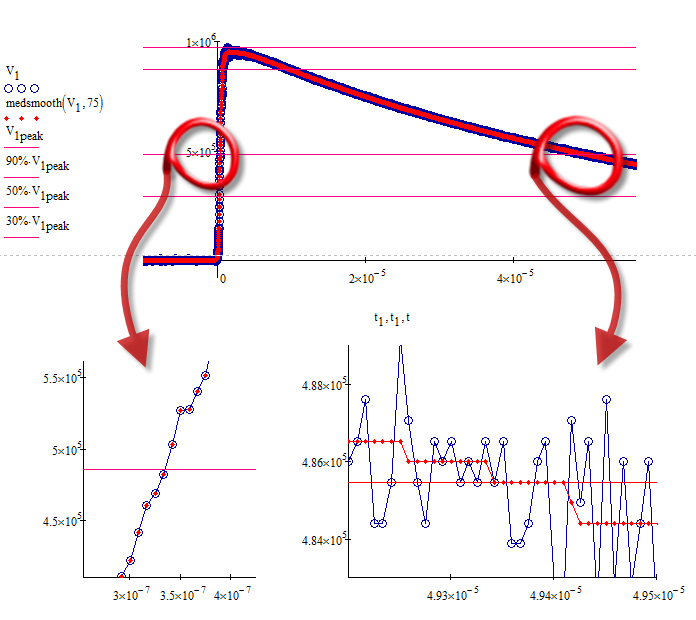
I gave the built-in smoothing routine a try. I used "medsmooth". Maybe you'd like to try "ksmooth", "supsmooth" or even "loess". I guess the results are better, but thats something you have to decide. The choice of the window width (has to be an odd number) has great influence over the outcome - in case of my lookup2 it influences heavily the size of the result vector.
Feb 12, 2013
10:45 PM
- Mark as New
- Bookmark
- Subscribe
- Mute
- Subscribe to RSS Feed
- Permalink
- Notify Moderator
Feb 12, 2013
10:45 PM
Hello again Mr. Exinger,
First off thank you very much for the routines, I am still trying to decipher how the programming within MATHCAD actually works, and what your code is doing.
However, one problem still remains, I need to reduce these vectors obtained by your lookup2 method down to one single value.
I was going to try to take an average of the elements in the vector resulting from your lookup2 method, but I it seems as though the first entry usually has quite the discrepency. (2 orders of magnitude)
How do you think I can reduce the results down to the single best possible value for our best guess at the desired value?
EDIT: One method I thought of is by simply taking the results from your lookup2 method and simply selecting the result that lies in the center row.
Let me know what you think!
Thank you very much for all your help it is much appreciated!
Feb 13, 2013
08:15 AM
- Mark as New
- Bookmark
- Subscribe
- Mute
- Subscribe to RSS Feed
- Permalink
- Notify Moderator
Feb 13, 2013
08:15 AM
What comes to my mind first is to smooth the graph to a greater degree, as the multiple nearby values seem to be because of some random noise in the signal.
Taking the average sounds like a good idea too. Whats wrong with the first entry? Did you zoom in the graph at that position to see if its really a valid value or a failure in my routine (good possible).
With the chopped graphs you should expect at least two valid solution (one on the upgoing part, the other at the downgoing). So taking the average of the whole vector does'n seem to be that good an idea in thar case. Maybe lookup(2) should be feeded with appropriate subvectors from the beginning to the chop-time.
Write back to tell me if the first solution of lookup2 is an error.
Feb 13, 2013
09:39 AM
- Mark as New
- Bookmark
- Subscribe
- Mute
- Subscribe to RSS Feed
- Permalink
- Notify Moderator
Feb 13, 2013
09:39 AM
Just gave it a try and I think lookup2 is doing right.
You have to be aware that regardless of Flashover or not you have at least two positions where your signal is 50% of the peak value (or 90% or 30%). One in the increasing phase and one in the decreasing one. Thats the reason for the descrepency of the first value you noticed and I think this single first value is exactly the one you are interested in, right?. Thats the time the signal passes (lets say) the 50% peak mark in the increasing phase, the rest are due to the decreasing signal. See the screenshot below for your first signal and the 50% peak mark. Blue is the original signal, red dots are the median smoothed signal. The first pass most of the time results in a single time value only because we have a large slope, but there is no guarantee that its always only a single value, depends on noise, etc. In the decreasing phase we have the problem (especially with the no flashover signals) of a rather slow decrease and therfore we have a lot of time values where the mark is passed. Increasing the parameter of medsmooth does not help here, maybe one of the other smoothing functions I mentioned will help.
You have to decide which of the (2?) values you need and how to deal with the multiples. If you can guarantee a specific time distance between the increasing and decreasing pass (that may be a little bit difficult for the 90% mark, I guess) that would help to distinguish between them.
Feb 13, 2013
06:08 PM
- Mark as New
- Bookmark
- Subscribe
- Mute
- Subscribe to RSS Feed
- Permalink
- Notify Moderator
Feb 13, 2013
06:08 PM
Hello again Mr. Exinger,
You have to decide which of the (2?) values you need and how to deal with the multiples. If you can guarantee a specific time distance between the increasing and decreasing pass (that may be a little bit difficult for the 90% mark, I guess) that would help to distinguish between them.
The 30% and 90% times should be taken while in the "increasing phase", while the 50% mark should be taken in the "decaying phase".
I think your suggestion of passing lookup2 the appropriate subvectors will alleviate the issue of obtaining valid, yet undesirable solutions.
For example, when solving for the 30%/90% times, only pass the points from the minimum voltage value to the maximum voltage value. This should serve as our approriate subvector which should be passed to the lookup2 routine.
Likewise for the 50% routine, only pass the points after the maximum voltage has occured to the lookup2 routine.
This should eliminate our undesirable solutions, correct? Once we have the undesirable solutions removed from our solution vector, taking an average should be reasonable in obtaining 1 single time value.
What do you think?
Thanks again for all your help and insight!
Feb 13, 2013
06:33 PM
- Mark as New
- Bookmark
- Subscribe
- Mute
- Subscribe to RSS Feed
- Permalink
- Notify Moderator
Feb 13, 2013
06:33 PM
I think the attached sheet does what you want.
I got rid of the smoothing routine, but maybe it would be still useful - at least for the chop time.
The 30%, 50% and 90% values are included for both phases - feel free to delete the unnecessary ones.
Feb 15, 2013
05:50 PM
- Mark as New
- Bookmark
- Subscribe
- Mute
- Subscribe to RSS Feed
- Permalink
- Notify Moderator
Feb 15, 2013
05:50 PM
Hello again Mr. Exinger,
I went through the sheet you provided, and as an exercise I decided to rewrite the sheet myself to make sure I understand how all of the programs function. (See attached, please note this I am still compiling everything)
EDIT: I have updated the attached file with a more complete version. I attempted to write my own descriptions of the functionality of each individual function. Please read them over to be sure I am understanding everything correctly.
Everything has been fine so far, the functions are essentially the same, I just changed a few names here and there.
There is one particular function I am having a difficult time understanding and that is the Marker function.
Is there anyway you can try to explain that one to me?
I think I understand the stack function, which essentially takes scalars or vectors and stacks them from top to bottom in the order they are input.
Why is VX being stacked twice on the second line? Theres alot of transposing and augmenting going on and I'm quite confused.
I look forward to your input, and thank you again for all your help I am very grateful.
Cheers!
Feb 15, 2013
09:29 PM
- Mark as New
- Bookmark
- Subscribe
- Mute
- Subscribe to RSS Feed
- Permalink
- Notify Moderator
Feb 15, 2013
09:29 PM
In the meantime I got rid of some of the vertical markers as you wrote in a recent post you only need three of the six I provided.
According to the Marker routine - I am not really proud of it as its rather cluttered and not as easy to read as it should be. I was confused myself a bit looking at it a second time. Its a moloch which has grown slowly, beginning with plotting each line segment singly and at last ending up in an own function.
I have prepended to the attached sheet some explanations about how to graph line segments and vertical and horizontal lines in particular. Hope this shed some light on the Marker routine. If not, feel free to ask again.
I only had a very quick glance over your sheet and I noticed, that you seem to need two vertical markers only. I see you have used the ugly Markers routine the way it is intended. I would have left the marker for choptime as the method chosen for determining it is rather sensible according to threshold and width so you will have an optical control if things go weird.
As for the two markes left, T2 is clear to me, its at T50post, but I wonder about T1 which is 5/3 times the difference of T90 and T30 (both "pre"). You take a time difference, which is a period of time (time interval) and use it as a specific point of time, which seems at least unusual, if not to say wrong, to me. Whats the consideration/thought of that?
I will give your worksheet a closer look later, if necessary.
BTW, I never realised how small worksheets get if you use collapsed areas - amazing.
Feb 17, 2013
12:43 PM
- Mark as New
- Bookmark
- Subscribe
- Mute
- Subscribe to RSS Feed
- Permalink
- Notify Moderator
Feb 17, 2013
12:43 PM
Hello Mr. Exinger,
The functionality behind the Marker routine is much more clear with the examples you created, thank you!
Werner Exinger wrote:
I only had a very quick glance over your sheet and I noticed, that you seem to need two vertical markers only. I see you have used the ugly Markers routine the way it is intended. I would have left the marker for choptime as the method chosen for determining it is rather sensible according to threshold and width so you will have an optical control if things go weird.
As for the two markes left, T2 is clear to me, its at T50post, but I wonder about T1 which is 5/3 times the difference of T90 and T30 (both "pre"). You take a time difference, which is a period of time (time interval) and use it as a specific point of time, which seems at least unusual, if not to say wrong, to me. Whats the consideration/thought of that?
This is simply how my text defines the front time for a given impulse.
I am very happy with the outcome of the worksheet thus far!
Can you explain to me how you split the worksheet into different sections? I would like to do this to my rewritten sheet aswell in order to make things much neater and organized.
Also, I noticed there your worksheet only displays chunks of text instead of a whole page, is this is what you are referring to as "collapsed areas"?
I cannot thank you enough for all your help!
Cheers!
Feb 17, 2013
02:59 PM
- Mark as New
- Bookmark
- Subscribe
- Mute
- Subscribe to RSS Feed
- Permalink
- Notify Moderator
Feb 17, 2013
02:59 PM
Christian Jegues schrieb:
Hello Mr. Exinger,
The functionality behind the Marker routine is much more clear with the examples you created, thank you!
You're welcome.
You take a time difference, which is a period of time (time interval) and use it as a specific point of time, which seems at least unusual, if not to say wrong, to me.
This is simply how my text defines the front time for a given impulse.
The mixing of time intervals and points of times is a not so seldom failure. Thats why I thought I should mention it. If you move your signal along the t-axis left or right, the point of time you calculate (T1) does not move with the graph, as the difference t90-t30 does not change. But probably is T1=T0+5/3*/T90-T30) with T0=0. This would make T1 a time point. Whats the technical meaning of that "front time".
I am very happy with the outcome of the worksheet thus far!
Glad to hear!
Can you explain to me how you split the worksheet into different sections? I would like to do this to my rewritten sheet aswell in order to make things much neater and organized.
Also, I noticed there your worksheet only displays chunks of text instead of a whole page, is this is what you are referring to as "collapsed areas"?
I think that both questions refer to the same thing - areas.
If you click at an empty space in your worksheet and then go to menu "insert" then "area" you see that two horizontal lines are inserted in your worksheet. you can move both ends of this area up down. All regions within these two lines are "in" the area. These areas can be collapsed (double click on the left arrow on one of the two horizontals), given a name or color (right click, properties) and can be locked by a password. A collapsed area is by default seen as a single horizontal line with an arrow on the left end. If you name the ares as I did you can tell Mathcad to show that name. You may format the area in a way that a collapsed area is not seen at all, but then you would have problems yourself finding it to reopen.
You either may lock a collapsed region so nobody can see whats going on in there while all the formulas are still active or you may lock an open area so everybody can see whats going on but is not allowed to change anything. Usually those areas are very convenient to hide utility routines and to structure a worksheet. Another way to use them is if you just want to print a specific portion of your sheet.
If you try to insert an area at a place too close to another area, the insert-area menu will be greyed out.
Be aware that Mathcad does not support areas within areas! While you may be able to drag one area over an existing, collapsed one and it may look as if everything is working OK - after saving and reopening that worksheet chances are that you have lost at least your innner area and maybe have a corrupted worksheet. So resist the temptation.
You can open or collaps as many areas as you like. Probably this is what you meant by my sheet only displaying chunks of text.
If all areas are collapsed the saved file gets very small, probably due to the fact that Mathcad saves kind of an image representation of everything visible.
Find attached a new version of my sheet. I have completely rewritten the Markers routine to make it more versatile and usable in other sheets as well, added two new routines for getting that chop time (the third one seems to be the most stable one) using linear regression. There is an area you can delete where I tried to find out why the get chop time routines are so sensible in respect to the threshold(slope) value. Main reason is - because the max slope is quite large as t-values are rather small and U-values quite large.
Also included is an area with a scripted component which lets you chose the datafile via a standard selection box. This component is the reason you will be asked by Mathcad on opening the file if it should disable scripting - obviously you would anser "No" to see how it works.
That component was taken from Richards fine collection at http://communities.ptc.com/docs/DOC-1071
EDITED: Changed attachment for a version with simplified Markers routines.
Stumbled across a strange problem in doing so which is hopefully solved in this thread: http://communities.ptc.com/message/197515#197515
Meassage edited by Werner Exinger Replaced attachment for one with better script so that the starting dir in file selection box is CWD
Feb 24, 2013
10:24 AM
- Mark as New
- Bookmark
- Subscribe
- Mute
- Subscribe to RSS Feed
- Permalink
- Notify Moderator
Feb 24, 2013
10:24 AM
Werner Exinger wrote:
... That component was taken from Richards fine collection at http://communities.ptc.com/docs/DOC-1071 ...
This link does not work.
Feb 24, 2013
10:38 AM
- Mark as New
- Bookmark
- Subscribe
- Mute
- Subscribe to RSS Feed
- Permalink
- Notify Moderator
Feb 24, 2013
10:38 AM
Somehow the editor attched three <br> at the url
http://communities.ptc.com/docs/DOC-1071
should work now.
But the original poster/querist doesn't seem to be around anymore anyway.

