
Turn on suggestions
Auto-suggest helps you quickly narrow down your search results by suggesting possible matches as you type.
Showing results for
Turn on suggestions
Auto-suggest helps you quickly narrow down your search results by suggesting possible matches as you type.
Showing results for
Community Tip - Learn all about PTC Community Badges. Engage with PTC and see how many you can earn! X
- Community
- Creo+ and Creo Parametric
- 3D Part & Assembly Design
- How to interpret stress analysis graph
Options
- Subscribe to RSS Feed
- Mark Topic as New
- Mark Topic as Read
- Float this Topic for Current User
- Bookmark
- Subscribe
- Mute
- Printer Friendly Page
How to interpret stress analysis graph
Jul 05, 2016
01:56 PM
- Mark as New
- Bookmark
- Subscribe
- Mute
- Subscribe to RSS Feed
- Permalink
- Notify Moderator
Jul 05, 2016
01:56 PM
How to interpret stress analysis graph
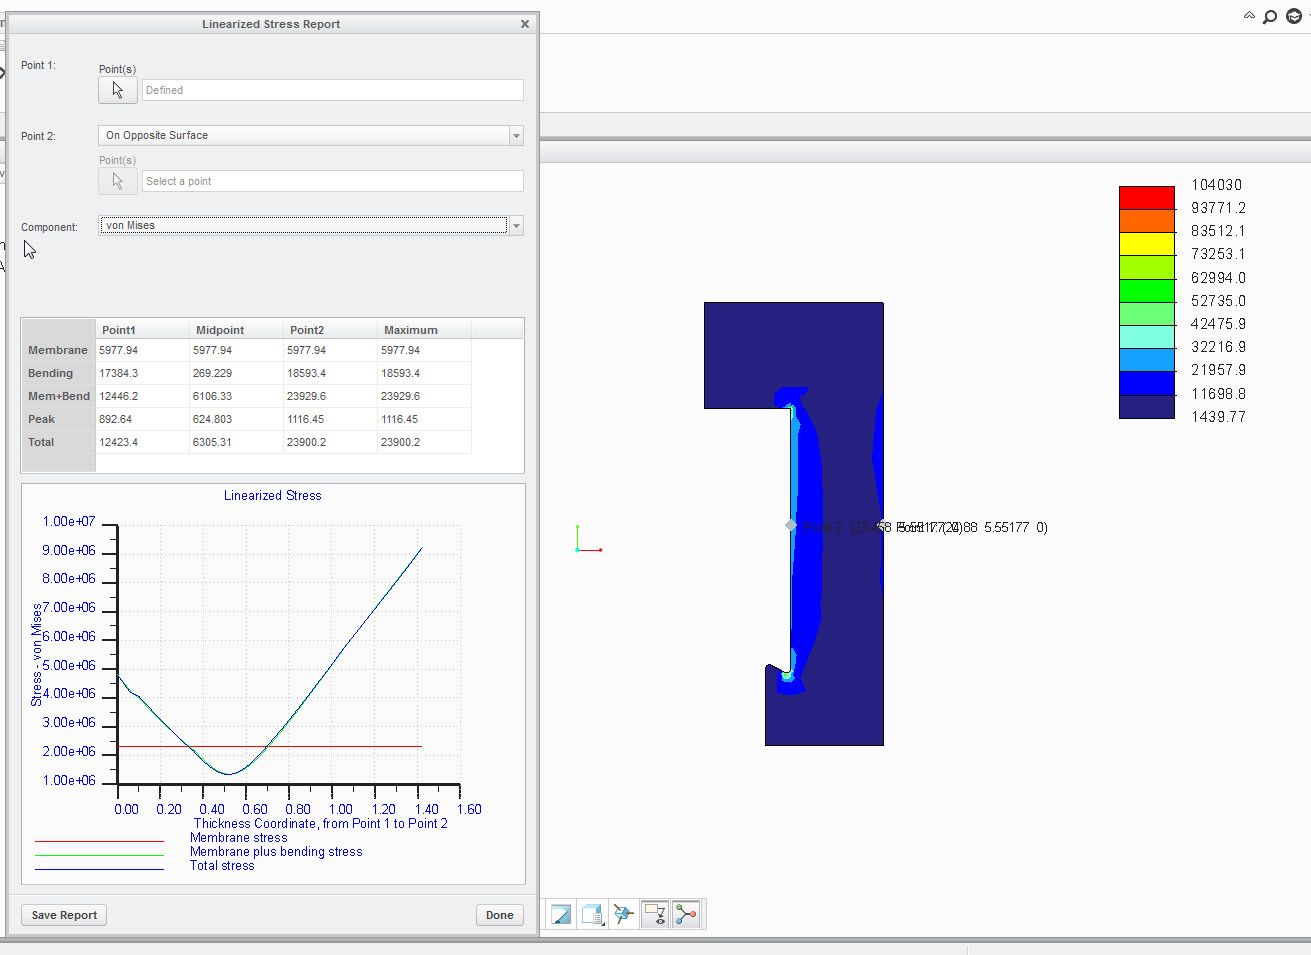
Using Creo 3/Simulate. Modeled a circular flange and am trying to use stress linearization (SL) to evaluate the stresses.
I chose Von Mises stresses. The SL results has two output sections: a text part showing the actual numbers through
the thickness and a graph part also showing thru thickness stresses. Numers for the text part look good. But the graph
is way off. the stresses shown are 20 times higher than the text output. Why is there such a large difference in the two outputs?
How do I get them to agree? See atachment.
This thread is inactive and closed by the PTC Community Management Team. If you would like to provide a reply and re-open this thread, please notify the moderator and reference the thread. You may also use "Start a topic" button to ask a new question. Please be sure to include what version of the PTC product you are using so another community member knowledgeable about your version may be able to assist.
Labels:
- Labels:
-
General
0 REPLIES 0
