
Turn on suggestions
Auto-suggest helps you quickly narrow down your search results by suggesting possible matches as you type.
Showing results for
Turn on suggestions
Auto-suggest helps you quickly narrow down your search results by suggesting possible matches as you type.
Showing results for
Community Tip - Did you get an answer that solved your problem? Please mark it as an Accepted Solution so others with the same problem can find the answer easily. X
Options
- Subscribe to RSS Feed
- Mark Topic as New
- Mark Topic as Read
- Float this Topic for Current User
- Bookmark
- Subscribe
- Mute
- Printer Friendly Page
Assign zone to a point
Mar 03, 2024
09:53 PM
- Mark as New
- Bookmark
- Subscribe
- Mute
- Subscribe to RSS Feed
- Permalink
- Notify Moderator
Mar 03, 2024
09:53 PM
Assign zone to a point
Hello @Werner_E and crew,
I've recently returned from a hiatus from the forum due to a busy schedule.
I'm back with a new project and seek your guidance.
I'm presenting the following scenario: I'm dealing with three rectangles or zones: A, B, and C. Each zone has a priority level. I have a list of points that I need to plot and require the program to determine the zone in which each falls. Should a point land on the boundary shared by two or three rectangles, the program should assign it to the zone with the highest priority. I've been working with Mathcad Prime 9 and have devised a solution, but I feel it's lacking because I haven't effectively incorporated the priority level. Could you recommend a more refined approach? Below are snapshots for easier reference. In the real world scenario, there will be many more zones and huge list of points.


Solved! Go to Solution.
Labels:
- Labels:
-
Mathcad Usage
-
Programming
1 ACCEPTED SOLUTION
Accepted Solutions
Mar 04, 2024
01:39 PM
- Mark as New
- Bookmark
- Subscribe
- Mute
- Subscribe to RSS Feed
- Permalink
- Notify Moderator
Mar 04, 2024
01:39 PM
I added the ability to provide the data for the various areas in different ways as the nested matrix used in first place may not be the most optimal structure.
Of course it depends on the way the area data is available in your actual application. I don't think that you are supposed to manually type it all in and using a separate Prime table for each of the example areas seems not to be an appropriate approach for a larger number of areas anyway.
Instead of the areas being a vector of vectors, you may also provide them using a matrix - each row of it representing an area, defined by a name (has not to be just one character of course), the coordinates of the lower left and upper right corner and its priority.
There are only two changes in the makeList() function necessary to accommodate for this structure:

It would also be possible to provide the data using Prime's tables.
But I guess that tables are not really helpful when it comes to larger data sets. Anyway, here is an approach using tables for input:

Modified Prime 9 sheet attached
27 REPLIES 27
Mar 03, 2024
10:53 PM
- Mark as New
- Bookmark
- Subscribe
- Mute
- Subscribe to RSS Feed
- Permalink
- Notify Moderator
Mar 03, 2024
10:53 PM
What should happen if the point belongs to two areas with equal priority - either because it lies on the border of the two or because the areas may overlap?
How should a point belonging to no area at all should be treated.
Mar 03, 2024
11:18 PM
- Mark as New
- Bookmark
- Subscribe
- Mute
- Subscribe to RSS Feed
- Permalink
- Notify Moderator
Mar 03, 2024
11:18 PM
Hello @Werner_E , overlapping can be ignored because all the rectangles will be defined so that they wont overlap.
If a point belongs to two areas with equal priority because it lies on the border of the two, then we need to decide on a consistent rule to determine which zone to assign. One common approach is to assign the zone based on a predefined ordering of the zones (for example, alphabetical order: if a point falls on the edge of zones A and B with equal priority, always choose A).
For points that belong to no area at all, you can return a value that indicates this, such as "None" or "Outside".
Mar 04, 2024
12:29 AM
- Mark as New
- Bookmark
- Subscribe
- Mute
- Subscribe to RSS Feed
- Permalink
- Notify Moderator
Mar 04, 2024
12:29 AM
Hi,
I am limited to Express at the moment so no programming.
Here are two function OnRect and InRect that return true 1 if is On Rectangle or In Rectangle.use OnRect() first then InRect
Cheers
Terry
Mar 04, 2024
01:17 AM
- Mark as New
- Bookmark
- Subscribe
- Mute
- Subscribe to RSS Feed
- Permalink
- Notify Moderator
Mar 04, 2024
01:17 AM
@terryhendicott wrote:
Hi,
I am limited to Express at the moment so no programming.
Here are two function OnRect and InRect that return true 1 if is On Rectangle or In Rectangle.use OnRect() first then InRect
Cheers
Terry
Quite elaborate, but wouldn't do
the same job as your InRect? Not sure but I guess that comparison and logical operators are available in Express, too.
In fact it seems that its not necessary to distinguish between "in" and "on".
Whenever a points belongs to two areas (either because its on the border of two adjacent areas or because its in the overlap of two areas) , we have to look for the priorities and from what I understood that part was the main reason for the question of @Perez here.
Mar 04, 2024
12:59 AM
- Mark as New
- Bookmark
- Subscribe
- Mute
- Subscribe to RSS Feed
- Permalink
- Notify Moderator
Mar 04, 2024
12:59 AM
See attached for a first attempt.

Its not ORIGIN-aware (ORIGIN must be set to zero) and it does not make use of units.
I was also adding some points and playing around with the colors of the dots 😉

Mar 04, 2024
01:45 AM
- Mark as New
- Bookmark
- Subscribe
- Mute
- Subscribe to RSS Feed
- Permalink
- Notify Moderator
Mar 04, 2024
01:45 AM
In case you don't want the function to return ALL the areas I point may belong to, you can change the program as shown below.
That way only the first entry (determined by the order in which the areas were defined) is returned.

BTW, if you increase the value of N in my sheet, you get a similar plot as shown by @ttokoro

I decided to generate only integer coordinates (using the " trunc" function) because I felt it looks better. That way only 2500 different points can be generated. By demanding 10000 points that means that many points were generated more than once and a few (the white "dots") are not generated at all.
If you delete the "trunc" functions you get something like this:

Mar 04, 2024
12:48 AM
- Mark as New
- Bookmark
- Subscribe
- Mute
- Subscribe to RSS Feed
- Permalink
- Notify Moderator
Mar 04, 2024
12:48 AM


Mar 04, 2024
01:20 AM
- Mark as New
- Bookmark
- Subscribe
- Mute
- Subscribe to RSS Feed
- Permalink
- Notify Moderator
Mar 04, 2024
01:20 AM
Your approach is missing the priority values!
I may be wrong, but as I understood incorporating them was the main reason of this question.
Furthermore @Perez wrote
In the real world scenario, there will be many more zones
and I guess it would be a bit cumbersome and lengthy to adapt your approach to a greater variety of areas 😉
Mar 04, 2024
03:08 AM
- Mark as New
- Bookmark
- Subscribe
- Mute
- Subscribe to RSS Feed
- Permalink
- Notify Moderator
Mar 04, 2024
03:08 AM
Changing B's x from 0 to 20 and C's y from 0 to 20, we get same result by the priority of if function. A>B>C>D...

Add star as first priority.

Mar 04, 2024
03:23 AM
- Mark as New
- Bookmark
- Subscribe
- Mute
- Subscribe to RSS Feed
- Permalink
- Notify Moderator
Mar 04, 2024
03:23 AM
@ttokoro wrote:
Changing B's x from 0 to 20 and C's y from 0 to 20, we get same result by the priority of if function. A>B>C>D...
Thats true, but I don't think that the "many more" zones in @Perez 's application are sorted by priority in descending order. At least they are not in his simplified example with just three zones.
If the zones would be sorted, then @Perez own approach which he posted initially would work OK as well with respect to the priority.
But maybe he will comment on that himself.
Mar 04, 2024
09:15 PM
- Mark as New
- Bookmark
- Subscribe
- Mute
- Subscribe to RSS Feed
- Permalink
- Notify Moderator
Mar 04, 2024
09:15 PM

Mar 04, 2024
04:52 AM
- Mark as New
- Bookmark
- Subscribe
- Mute
- Subscribe to RSS Feed
- Permalink
- Notify Moderator
Mar 04, 2024
04:52 AM
Does the input have to be the way it is now? As the areas are rectangles you only need xmin, xmax, ymin and ymax to define them. When you add to that two columns (label and priority), you have a matrix with the required input. Your new problem becomes sorting that by priority taking into account the original order in case of equal priority. After that choosing the area, where point belongs, becomes trivial - you just check the modified input row by row and the first hit is the area for that point.
You can naturally use the current input to form the new one as a second choice.
Mar 04, 2024
08:20 AM
- Mark as New
- Bookmark
- Subscribe
- Mute
- Subscribe to RSS Feed
- Permalink
- Notify Moderator
Mar 04, 2024
08:20 AM
Hi,
Here is the sorting in Prime Express Only
Cheers
Terry
Mar 04, 2024
01:51 PM
- Mark as New
- Bookmark
- Subscribe
- Mute
- Subscribe to RSS Feed
- Permalink
- Notify Moderator
Mar 04, 2024
01:51 PM
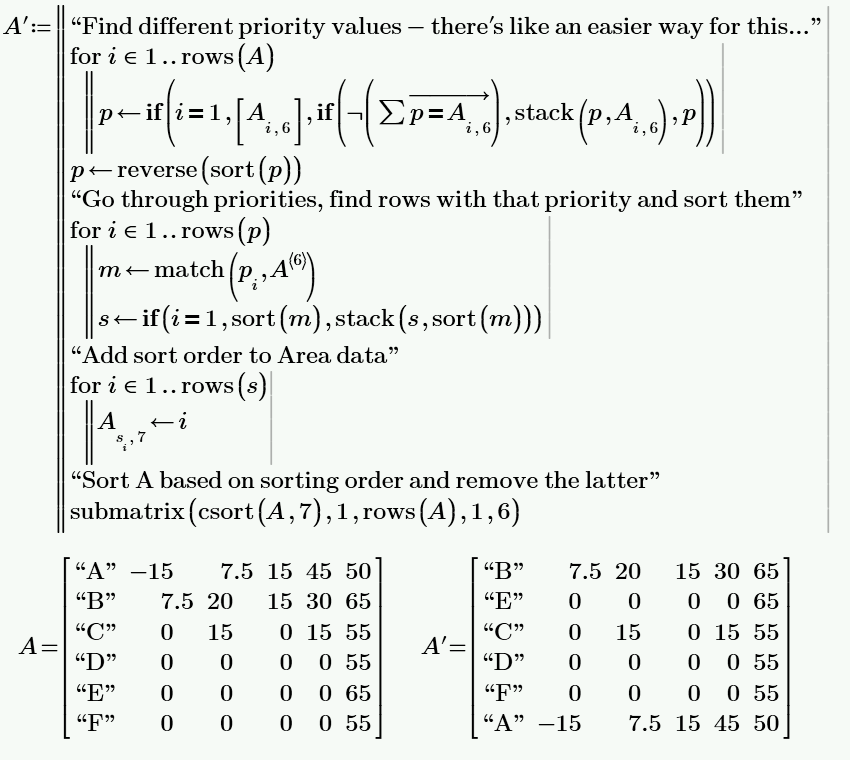
Sorting of the array could also be accomplished using "csort" and "reverse". But doing so would NOT preserve the order of the elements with equal value. So in your example "E" would be the first entry for priority 65 and not "B".
If thats not a problem (as I understood @Perez had just demanded a consistent rule, the order of definition was just a suggestion/example) we could as well use

In the original sheet the 6 should be replaced by 5 because it uses ORIGIN=0.
Mar 04, 2024
04:01 PM
- Mark as New
- Bookmark
- Subscribe
- Mute
- Subscribe to RSS Feed
- Permalink
- Notify Moderator
Mar 04, 2024
04:01 PM
I think I covered that in the beginning of the sheet. In order to get the original order the matrix needed to be reversed also before sorting. However, Mathcad help says that the sorting functions are not stable, which they indicated meant that the order of equal values could vary. Thus the more complex approach.
Mar 04, 2024
06:04 PM
- Mark as New
- Bookmark
- Subscribe
- Mute
- Subscribe to RSS Feed
- Permalink
- Notify Moderator
Mar 04, 2024
06:04 PM
Sorry, must have overlooked that you showed csort at the beginning of the sheet.
While it sounded like the order of the areas won't matter if a point belongs to more than one area (up to four possible if the areas don't overlap), I too in my approach returned the areas in the order they were defined. Because it was my goal to return all areas a point would belong to, it was a more elaborate but I already pointed out what to change if only the first area should be returned.
But we'll have to wait until the questioner shows interest again and makes this clear and tells us his preferences.
BTW, here is an alternative to create a 'properly' sorted array A - again using "match" with the "not" modifier 😉

It fails if only one area is defined, though.
Mar 05, 2024
02:53 AM
- Mark as New
- Bookmark
- Subscribe
- Mute
- Subscribe to RSS Feed
- Permalink
- Notify Moderator
Mar 05, 2024
02:53 AM
Much better than mine. I'd formulate the same a bit differently, though. Unfortunately both versions have the same failure, but it is not one area - it is one priority.

Mar 05, 2024
10:02 AM
- Mark as New
- Bookmark
- Subscribe
- Mute
- Subscribe to RSS Feed
- Permalink
- Notify Moderator
Mar 05, 2024
10:02 AM
Yes, using the local function may make it look a bit clearer. I usually try to avoid that kind of "if" in the for loop just to get around the shortcoming that Prime not providing something like an empty field to start a vector or matrix with. Reason is that this "if" is called in every pass of the loop which I consider inefficient (even though the effect is negligible in our case).
BTW, the problem actually is the number of areas (not the number of priorities) which must not be 1.. Two areas with the same priority should not be a problem.
Mar 05, 2024
10:11 AM
- Mark as New
- Bookmark
- Subscribe
- Mute
- Subscribe to RSS Feed
- Permalink
- Notify Moderator
Mar 05, 2024
10:11 AM
Interesting point about the efficiency.
The failure is in the match function, when it can't find any value not matching the pi. Two rows with same priority give the error as well.
Mar 05, 2024
11:19 AM
- Mark as New
- Bookmark
- Subscribe
- Mute
- Subscribe to RSS Feed
- Permalink
- Notify Moderator
Mar 05, 2024
11:19 AM
Oops, of course you are right. I stand corrected.
The remark about efficiency only applies to very large loops. If in that case we can avoid an "if", we should do it. If we can't avoid it it may help to put the most likely case in the "yes" branch. But in case of maybe a few dozens areas this has no significance at all 😉
Mar 05, 2024
01:00 PM
- Mark as New
- Bookmark
- Subscribe
- Mute
- Subscribe to RSS Feed
- Permalink
- Notify Moderator
Mar 05, 2024
01:00 PM
I know it doesn't matter here, but the 100-page document with FEM solver built-in that I've tried to edit is another matter entirely. 😉
Mar 05, 2024
02:37 PM
- Mark as New
- Bookmark
- Subscribe
- Mute
- Subscribe to RSS Feed
- Permalink
- Notify Moderator
Mar 05, 2024
02:37 PM
Yes, I can imagine.
Ever so often people here in the forum come by and moan about long calculation times of programs in their sheet and sometimes just small changes do wonder so that I was surprised myself. The time-critical points are often not that easy to identify.
Mar 04, 2024
01:39 PM
- Mark as New
- Bookmark
- Subscribe
- Mute
- Subscribe to RSS Feed
- Permalink
- Notify Moderator
Mar 04, 2024
01:39 PM
I added the ability to provide the data for the various areas in different ways as the nested matrix used in first place may not be the most optimal structure.
Of course it depends on the way the area data is available in your actual application. I don't think that you are supposed to manually type it all in and using a separate Prime table for each of the example areas seems not to be an appropriate approach for a larger number of areas anyway.
Instead of the areas being a vector of vectors, you may also provide them using a matrix - each row of it representing an area, defined by a name (has not to be just one character of course), the coordinates of the lower left and upper right corner and its priority.
There are only two changes in the makeList() function necessary to accommodate for this structure:
It would also be possible to provide the data using Prime's tables.
But I guess that tables are not really helpful when it comes to larger data sets. Anyway, here is an approach using tables for input:
Modified Prime 9 sheet attached
Mar 04, 2024
08:00 PM
- Mark as New
- Bookmark
- Subscribe
- Mute
- Subscribe to RSS Feed
- Permalink
- Notify Moderator
Mar 04, 2024
08:00 PM
Hello @Werner_E , I'm reviewing your latest file WE_20240304(3)_PointLocator_V1.0 and running some tests but it seems the function makeList2() is working as expected so far. I should be able to accept as solution by the end of the week. Thank you for looking into this.
Mar 04, 2024
08:11 PM
- Mark as New
- Bookmark
- Subscribe
- Mute
- Subscribe to RSS Feed
- Permalink
- Notify Moderator
Mar 04, 2024
08:11 PM
All the makeList() functions are doing the same and can be modified so that each point is assigned just one area only as described above.
The difference is just the way the areas data is provided. This essentially depends on the form in which you have this data at hand and how you import it into Prime. It is also conceivable to define the areas by the coordinates of one corner along with height and width.
However, my first chosen data structure with the nested vectors is probably rather unfavorable. The matrix, which was also suggested by JKT, is probably the most practical structure, I guess.
Mar 13, 2024
10:52 AM
- Mark as New
- Bookmark
- Subscribe
- Mute
- Subscribe to RSS Feed
- Permalink
- Notify Moderator
Mar 13, 2024
10:52 AM
Hello @Werner_E , I have completed the review, and your latest file, WE_20240304(3)_PointLocator_V1.0, can be accepted as the solution. I appreciate that you incorporated the capability to account for overlapping areas, ensuring that the program always selects the zone with the highest priority when the specifications change. In practical application, we have a limited number of defined areas (less than 50) that, once established, won't change throughout the project's progress, making the prime table efficient for its ease of copying and pasting from Excel. For the points, this will involve a significantly larger dataset, which can be conveniently read from Excel using the readexcel function.
Regarding the area plots, is there a way to enhance the display so that the area names appear as part of the trace name? Additionally, could you explain this construct?

Here is the plot reproduced with your function:

Here is the original plot where I can associate the color with the area name through the trace name, such as XA and YA for area "A":

Mar 13, 2024
04:15 PM
- Mark as New
- Bookmark
- Subscribe
- Mute
- Subscribe to RSS Feed
- Permalink
- Notify Moderator
Mar 13, 2024
04:15 PM
A rectangle with sides parallel to the x- and y-axis is defined by four values only which I had used in the data structure I had chose for an "area".
The function "Ar ( )" creates the structure necessary to plot the rectangle. This structure is a 5+2 matrix with a total of 10 values (only four different ones are involved, though), similar to the one you used to define an "area" in your initial attempt. The reason I used the transposed matrix simply was to save vertical space so the function would be two lines high instead of 5 lines.
According showing the names of the areas in the plot, Prime provides no mean to do so. It doesn't even provide a mean to add a legend (the latter is available when you choose to use the third party add-on Chart component instead of Prime's native plot facility).
@LucMeekes had posted a set of utility functions which allowed to show text strings in a 2D (and I think also in a 3D) plot).
See here: Toolbox: Text plotting
If you meant that you just want to have an indication of the area name at the axis expressions, I see two quick ways to achieve this:
1) In front of the plot precalculate the structure necessary for plotting and assign it an appropriate variable name, similar to what you had achieved in your approach with XA, YA etc.
As an example for area "B" you would define
and in the plot you use instead of


2) You could use a modified function "Ar ()" which now does not expect the area itself as input argument but rather the name of an area in the "areas" list.

The plot would now look like this - the axis expressions make for some kind of poor mans legend


