
Turn on suggestions
Auto-suggest helps you quickly narrow down your search results by suggesting possible matches as you type.
Showing results for
Turn on suggestions
Auto-suggest helps you quickly narrow down your search results by suggesting possible matches as you type.
Showing results for
Community Tip - You can change your system assigned username to something more personal in your community settings. X
Options
- Subscribe to RSS Feed
- Mark Topic as New
- Mark Topic as Read
- Float this Topic for Current User
- Bookmark
- Subscribe
- Mute
- Printer Friendly Page
Data Preparation for Bicubic2D Function in MATHCAD Prime 9.0
Nov 16, 2023
02:27 PM
- Mark as New
- Bookmark
- Subscribe
- Mute
- Subscribe to RSS Feed
- Permalink
- Notify Moderator
Nov 16, 2023
02:27 PM
Data Preparation for Bicubic2D Function in MATHCAD Prime 9.0

Good evening all. I have digitized some data points (see the 3D picture), in order to use interpolations in 3D.
The data are arranged in a matrix with N rows and 3-columns, each representing a coordinate. I need to create a data matrix for the functions "Bicubic2D" and "Create Mesh". The idea is to sort the data by the Z values and for each of them retrieving the matching X and Y values. Unfortunately duplicate Z-values are found, but belonging to different set of X and Y values. I would need some hints if someone encountered such a challenge before. Thanks in advance for the help.
Regards,
Gianfranco
Solved! Go to Solution.
Labels:
- Labels:
-
Mathcad Usage
1 ACCEPTED SOLUTION
Accepted Solutions
Apr 12, 2024
01:59 PM
- Mark as New
- Bookmark
- Subscribe
- Mute
- Subscribe to RSS Feed
- Permalink
- Notify Moderator
Apr 12, 2024
01:59 PM
I finally solved with this last hint the problem of mapping the points over a square domain. I just projected all the points on the reference plane Z=0. Then I removed the points that were too close to each other (as result of the intersecting curves) and reduced the set of initial points. After that I considered a net of X and Y values uniformly spaced and retrieved the ones close to a net point. After that the mapping was correct and win equal number of points in both X and Y direction. Then I checked the values interpolated vs the curves I digitized and the result was very good. I wish one day MATHCAD will have the interpolation function working also with different numbers of values in X and Y.
Thanks to everyone for the help. Problem solved!
12 REPLIES 12
Nov 16, 2023
08:45 PM
- Mark as New
- Bookmark
- Subscribe
- Mute
- Subscribe to RSS Feed
- Permalink
- Notify Moderator
Nov 16, 2023
08:45 PM
If you have a function such as , you can plot the any z line of the function.


However, if you have only some f(x,y,z) lines data. you must interpolate the 3D surface and then plot the equi-z line.
Attach your data by Prime sheet, then some one help you to make it.
Nov 17, 2023
03:51 AM
- Mark as New
- Bookmark
- Subscribe
- Mute
- Subscribe to RSS Feed
- Permalink
- Notify Moderator
Nov 17, 2023
03:51 AM


Nov 21, 2023
10:46 AM
- Mark as New
- Bookmark
- Subscribe
- Mute
- Subscribe to RSS Feed
- Permalink
- Notify Moderator
Nov 21, 2023
10:46 AM
This is exactly what I would like to achieve. However data preparation is quite cumbersome without pre-processing the raw data.
I tried to sort the matrix I created to visualize the points by the 3rd column (Z values) and try to retrieve the X and Y values corresponding to those ones. With lookup and/or match functions i got stuck because duplicated values/occurrences won't select all the values needed to build the matrix M needed to perform the interpolation.
Thanks for your the example.
Nov 23, 2023
07:19 AM
- Mark as New
- Bookmark
- Subscribe
- Mute
- Subscribe to RSS Feed
- Permalink
- Notify Moderator
Nov 23, 2023
07:19 AM
Red plot shows (Y vs Z at constant X values) fails at Y>0.5. Blue plot shows the linear interpolation of (X vs Y at constant Z values) but using higher interpolation functions, it fails to make good interpolation plot. So using all your data and select each good region. Then plot all results.


Nov 24, 2023
12:56 PM
- Mark as New
- Bookmark
- Subscribe
- Mute
- Subscribe to RSS Feed
- Permalink
- Notify Moderator
Nov 24, 2023
12:56 PM
Thanks for the suggestion ttokoro. I will use the patch approach you are suggesting. However I will also implement it together with the suggestion proposed by Werner to use curve best fit and then re-export the points at regular X and Y interval filling the gaps.
I will post the solution once I have prepared it.
Grazie.
Nov 30, 2023
01:30 AM
- Mark as New
- Bookmark
- Subscribe
- Mute
- Subscribe to RSS Feed
- Permalink
- Notify Moderator
Nov 30, 2023
01:30 AM
Using all data it can plot like this. If you have the z data for x=0,0.1..1 and y=0,0.1..1 it is easy to interpolate by Bicubic2D function.

Apr 12, 2024
01:59 PM
- Mark as New
- Bookmark
- Subscribe
- Mute
- Subscribe to RSS Feed
- Permalink
- Notify Moderator
Apr 12, 2024
01:59 PM
I finally solved with this last hint the problem of mapping the points over a square domain. I just projected all the points on the reference plane Z=0. Then I removed the points that were too close to each other (as result of the intersecting curves) and reduced the set of initial points. After that I considered a net of X and Y values uniformly spaced and retrieved the ones close to a net point. After that the mapping was correct and win equal number of points in both X and Y direction. Then I checked the values interpolated vs the curves I digitized and the result was very good. I wish one day MATHCAD will have the interpolation function working also with different numbers of values in X and Y.
Thanks to everyone for the help. Problem solved!
Nov 21, 2023
10:38 AM
- Mark as New
- Bookmark
- Subscribe
- Mute
- Subscribe to RSS Feed
- Permalink
- Notify Moderator
Nov 21, 2023
10:38 AM
Thanks to all for the suggestions already posted.
I attach below the MATHCAD PRIME worksheet containing the raw data and the plots I have shown in my initial message.
Unfortunately I don't have the equations describing the surface, but only lines representing cut of the surface with planes parallel to the main ones and located at some constant values.
I was thinking to perform a numerical fitting with a least square technique, like I normally do when I have to smooth points along a best fit curve.
I thought that MATHCAD would have some function to do it on a 3D space.
I appreciate your help.
Regards,
Gianfranco
Nov 17, 2023
09:14 AM
- Mark as New
- Bookmark
- Subscribe
- Mute
- Subscribe to RSS Feed
- Permalink
- Notify Moderator
Nov 17, 2023
09:14 AM
I agree with ttkoro that you should post a worksheet including your data so we have something to play with 😉
I don't think that duplicate z-values should e a problem.
But to be able to use bicubic2D you need to provide z-values for every combination of x- and y-values present in your data set and I guess that thats not the case. So the problem may be fill those gaps.
Must it be a solution using bicubic2D?
Maybe you know something about the type of the surface function your data points are lying on and you can use a regression/fit rather than an interpolation?
Nov 21, 2023
10:56 AM
- Mark as New
- Bookmark
- Subscribe
- Mute
- Subscribe to RSS Feed
- Permalink
- Notify Moderator
Nov 21, 2023
10:56 AM
Hello Werner,
thanks for the hint. If I correctly understand I should fit all the curves I digitalized using a best fit technique and once I have them re-map the points at constant X and Y, retrieving the Z values, then build the M matrix with the Z values.
As I mentioned before I don't have the mathematical representation of the surface. The paper I am currently implementing in MATHCAD was produced long before computers became desktop tools as today. Therefore interpolation was the usual way to retrieve intermediate values. Unfortunately the surface was mapped on three plots such as (X vs Y at constant Z values), (Y vs Z at constant X values) and (X vs Z at constant Y values). Therefore, linear interpolation cannot be used because any curve represented in the three plot works as interpolator for the remaining ones.
I hope my English is clear.
Thanks for the initial hints.
Nov 21, 2023
11:36 AM
- Mark as New
- Bookmark
- Subscribe
- Mute
- Subscribe to RSS Feed
- Permalink
- Notify Moderator
Nov 21, 2023
11:36 AM
As I mentioned before I don't have the mathematical representation of the surface.
Thats clear, but you probably know which process generated the data you have and chances are that therefore you know something about the type of function (3D, surface, not the individual curves) we have to expect and maybe also of how parameters it depends on. This sure would help to chose an appropriate type to try a least square fit (using a solve bock with "minerr"). As far as I am aware Prime does not offer a function to do that with 3D data (like "genfit" would do for 2D data).
From the data you posted it looks like you have more than just a bunch of points - looks like you have the data from a couple of slices with x=const, y=const and z=const. Is it know which type of curves this should be - some info like "z=const" are parabolas, y=const are logarithmic curves, ....
I once wrote a function to do 3D interpolation (linear or cubic splines) but this function would need matrices for the data and so i guess we would have the same problems as destilling the matrix needed for bicubic2D.
Furthermore my function would only use your A and B data and would completely ignore the D data (z=const).
Not sure at the time how we could use the D data additionally to improve the interpolation quality.
Nov 21, 2023
12:08 PM
- Mark as New
- Bookmark
- Subscribe
- Mute
- Subscribe to RSS Feed
- Permalink
- Notify Moderator
Nov 21, 2023
12:08 PM
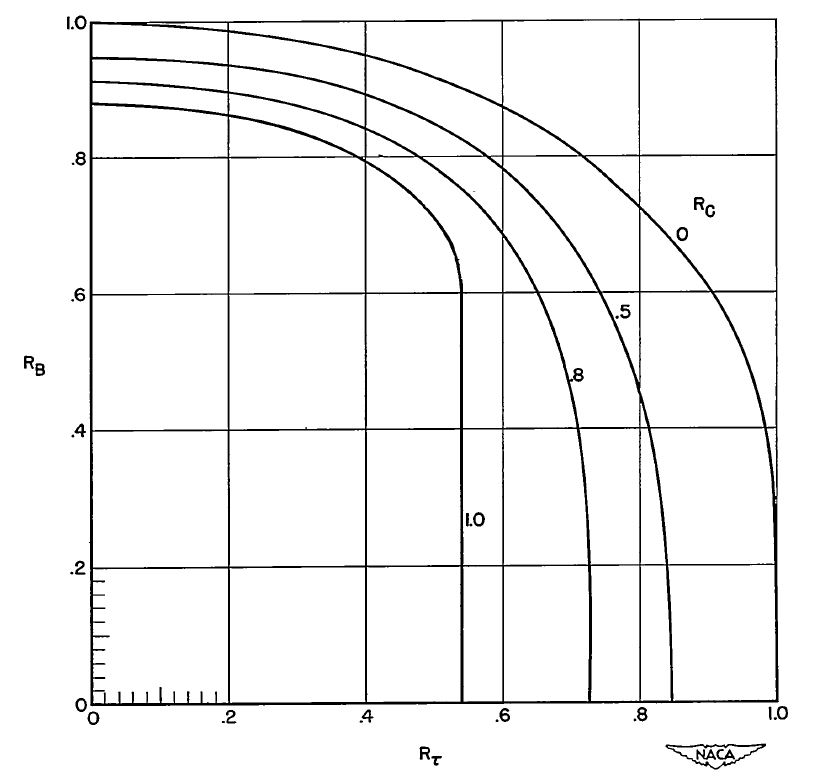
The curves from the paper are attached for your consideration. Some of them degenerate in a point as you can see.
The issue is also that when a parameter is held constant the values are not the same for all the set of curves.
The curve fitting was quite a problem with the set of curves in Fig. 3 because they end up in a vertical segment and all the interpolation functions require the independent variable to sortable in ascending order. Anyway this can be overcome by adding an artificial slope close to a vertical and the approximation might be possible.
To identify the type of functions for the set of curve is difficult. I normally use a linear combination of generic function with different parameters and implement a least square fitting. As you can see below some curve have discontinuities. Anyway I think I will have to work more to get it done properly. It looks like a typical ill-posed problem, where the solution is either not unique and/or smooth.
Thanks Werner.


