Community Tip - When posting, your subject should be specific and summarize your question. Here are some additional tips on asking a great question. X
- Subscribe to RSS Feed
- Mark Topic as New
- Mark Topic as Read
- Float this Topic for Current User
- Bookmark
- Subscribe
- Mute
- Printer Friendly Page
Derivative of Vector data with smoothing/fitting
- Mark as New
- Bookmark
- Subscribe
- Mute
- Subscribe to RSS Feed
- Permalink
- Notify Moderator
Derivative of Vector data with smoothing/fitting
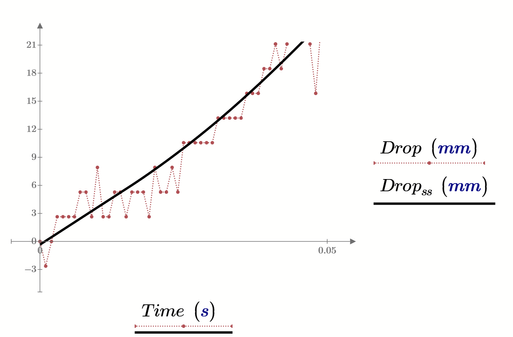
I have been performing drop testing with a product. Collected data shows displacement during the freefall and deceleration to a stop. I've tried several methods of data smoothing and curve fitting. The best I have achieved gives incorrect initial velocity and acceleration.
In the image below, after smoothing (blue line), it shows an initial velocity rather an acceleration from zero. Any ideas on how to accomplish my goal would be appreciated. See the attached Mathcad Prime 9 document.
Thanks,
Bob
- Tags:
- data analysis
- Mark as New
- Bookmark
- Subscribe
- Mute
- Subscribe to RSS Feed
- Permalink
- Notify Moderator
How should supersmooth know that you want a curve with a zero slope at t=0?
From the given data (red) it really does not look that way:
If you know the type of equation you expect for drop(t), you could try a non-linear regression to find its best fitting parameters using the measured data.
Just a question because I am confused: When I look at the Excel component
I can't see that you export column A to a variable "Time", Nonetheless variable "Time" with the correct unit seconds is defined after the Excel component. I wonder where an assignment like
which obviously must be present would hide ?? I was not able to find it even after resizing the component.
- Mark as New
- Bookmark
- Subscribe
- Mute
- Subscribe to RSS Feed
- Permalink
- Notify Moderator
Hi Werner, I was certain you'd respond.
Time is in the output of the spreadsheet. Not sure why you don't see it.
It is always a challenge to make recorded data reflect reality. In reality, the drop starts from zero distance and proceeds. Noisy data makes it a challenge. With a pencil and paper, it is easy to draw lines over the data to make the curves. The challenge is getting the computer to understand what you eye sees intuitively.
Supersmooth does a nice job of making the line my eye sees. Unfortunately, I'm not being successful in taking that to the next step of deriving velocity and acceleration cleanly. I don't know if there is a better method of normalizing and fitting the data.
- Mark as New
- Bookmark
- Subscribe
- Mute
- Subscribe to RSS Feed
- Permalink
- Notify Moderator
Crazy, I knew that that definition for Time in the Output area must be somewhere, but I am still not able to make it visible.
According smoothing I can't think of a suitable solution.
Best approach may be a curve fit but this would require you to be able to specify a function type to which the process corresponds.
- Mark as New
- Bookmark
- Subscribe
- Mute
- Subscribe to RSS Feed
- Permalink
- Notify Moderator
I've toyed around with a differential equation for the curve fit. It resembles the PID function in a servo position response. No success in getting a solution though.
- Mark as New
- Bookmark
- Subscribe
- Mute
- Subscribe to RSS Feed
- Permalink
- Notify Moderator
I played around too, but without great success.
I tried a function type for the free fall considering friction of air and then two other more general sigmoid functions.
I attach my 'results' here anyway.


