
Turn on suggestions
Auto-suggest helps you quickly narrow down your search results by suggesting possible matches as you type.
Showing results for
Turn on suggestions
Auto-suggest helps you quickly narrow down your search results by suggesting possible matches as you type.
Showing results for
Options
- Subscribe to RSS Feed
- Mark Topic as New
- Mark Topic as Read
- Float this Topic for Current User
- Bookmark
- Subscribe
- Mute
- Printer Friendly Page
How i will increase the number of division after point incase of tracing the numerical value from graph in Mathcad 15ptc?
May 12, 2016
02:50 PM
- Mark as New
- Bookmark
- Subscribe
- Mute
- Subscribe to RSS Feed
- Permalink
- Notify Moderator
May 12, 2016
02:50 PM
How i will increase the number of division after point incase of tracing the numerical value from graph in Mathcad 15ptc?
I Need Some Help From This Community.
Labels:
- Labels:
-
Other
7 REPLIES 7
May 12, 2016
05:22 PM
- Mark as New
- Bookmark
- Subscribe
- Mute
- Subscribe to RSS Feed
- Permalink
- Notify Moderator
May 12, 2016
05:22 PM
I don't think you can, but why do you need to? If you can plot the graph then you have data or a function to calculate it, so you can just calculate a value with more decimal places.
May 12, 2016
11:52 PM
- Mark as New
- Bookmark
- Subscribe
- Mute
- Subscribe to RSS Feed
- Permalink
- Notify Moderator
May 12, 2016
11:52 PM
I am working in a thesis project on " Effect of Non Linear Vibration on Functionally Graded Beam". I need exact value of frequencies from Displacement Vs Time graph by Tracing operation in Mathcad. I can Trace the value from graph but in this case the value are obtained the following form:0.36 . But i need the following format :0.365611
May 13, 2016
06:50 AM
- Mark as New
- Bookmark
- Subscribe
- Mute
- Subscribe to RSS Feed
- Permalink
- Notify Moderator
May 13, 2016
06:50 AM
I agree with Richard that you are probably better off writing a function to give you the values you want.
However, one way round it may be to turn off Track Data Points in Trace and use Zoom to get closer to the values you want. If you leave Track Data Points on, then Trace will skip to the default values, even if they are off the part of the plot you are looking at. Turning Track Data Points off allows you to pick a particular point on the trace. It's rather mandraulic, though, and will take up time and effort doing all that zooming.

Stuart
May 13, 2016
08:07 AM
- Mark as New
- Bookmark
- Subscribe
- Mute
- Subscribe to RSS Feed
- Permalink
- Notify Moderator
May 13, 2016
08:07 AM
What you are asking for makes no sense to me. You have data or a function for displacement vs time, or you would not be able to plot the graph, therefore you can calculate the displacement at a given time (or vice versa). Please explain exactly what you are trying to accomplish, because whatever it is, reading numbers off a graph is certainly not the best way to do it. Even better would be to post a worksheet showing what you are trying to do.
May 13, 2016
09:18 AM
- Mark as New
- Bookmark
- Subscribe
- Mute
- Subscribe to RSS Feed
- Permalink
- Notify Moderator
May 13, 2016
09:18 AM
If you have a data file of times and displacements, and you want frequencies, I suggest you consider doing FFT's of the data.
May 13, 2016
08:18 AM
- Mark as New
- Bookmark
- Subscribe
- Mute
- Subscribe to RSS Feed
- Permalink
- Notify Moderator
May 13, 2016
08:18 AM
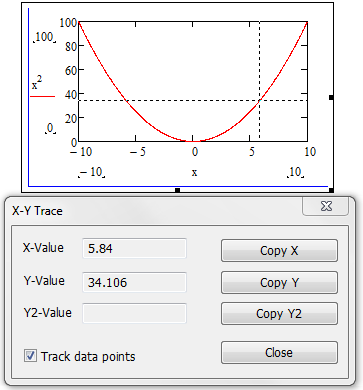
You can increase the accuracy of the trace by reducing the range plotted:

May 13, 2016
08:32 AM
- Mark as New
- Bookmark
- Subscribe
- Mute
- Subscribe to RSS Feed
- Permalink
- Notify Moderator
May 13, 2016
08:32 AM
You can also specify the trace step increment by plotting over a range variable:
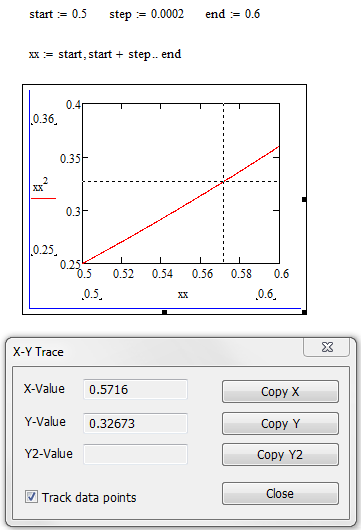
(X-Value trace steps in increments of 0.0002)
However, please note that I agree with the others above who are suggesting you obtain the values you want fromt he original function (or data set) that drives the graph.

