Community Tip - You can Bookmark boards, posts or articles that you'd like to access again easily! X
- Subscribe to RSS Feed
- Mark Topic as New
- Mark Topic as Read
- Float this Topic for Current User
- Bookmark
- Subscribe
- Mute
- Printer Friendly Page
How to automatically extract the range of frequency and how to find the time for maximum values
- Mark as New
- Bookmark
- Subscribe
- Mute
- Subscribe to RSS Feed
- Permalink
- Notify Moderator
How to automatically extract the range of frequency and how to find the time for maximum values
Hi,
1. How can I search for each frequency range?
For example I looked into the excel file and I saw that 1kHz begin from line 61536 and is ended at line 62560:
.
.
.
Therefore I extracted manually the respective range in Mathcad:
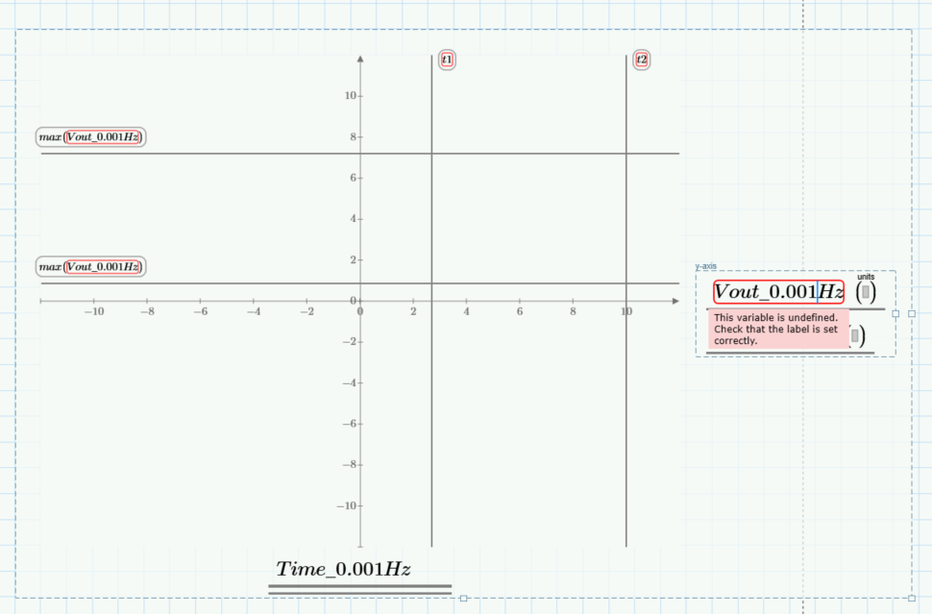
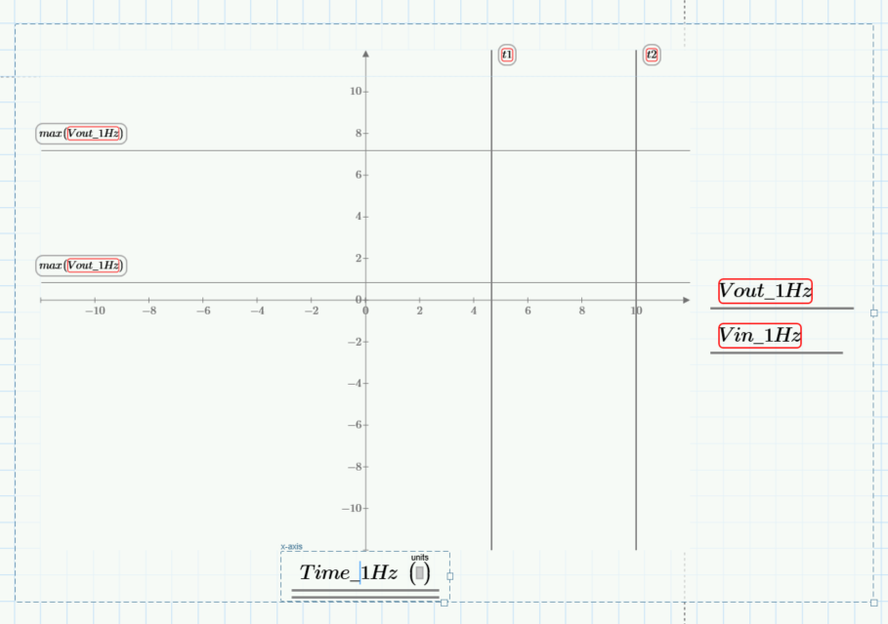
So, for example I want to know between what range the 0.001Hz begging and ends, but without staying and looking into excel file, some automatic routine if can be made in Mathcad:
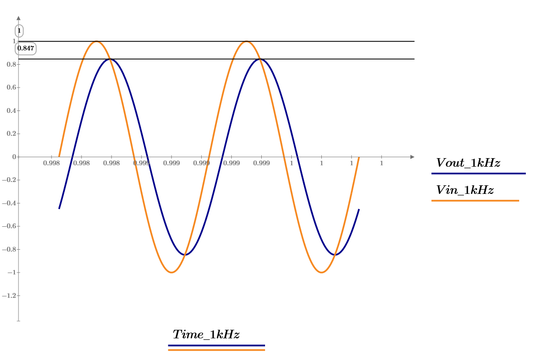
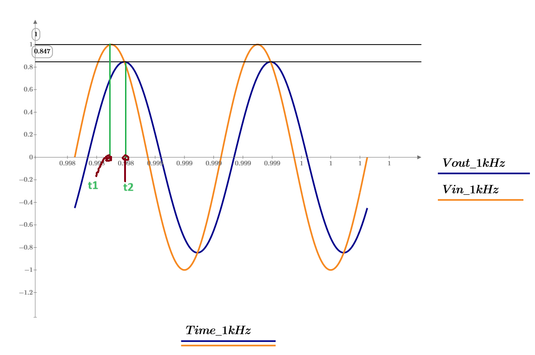
And then I want to know the maximum value for Vout and Vin at the respective Frequency and at which time these maximum values are occuring:
Above its only the maximum value at 1kHz, but I do not know at what time these maximum values for Vout and Vin are occuring.
Because I want to know then the difference between t2-t1.
Solved! Go to Solution.
- Labels:
-
Electrical_Engineering
-
Mathcad Usage
Accepted Solutions
- Mark as New
- Bookmark
- Subscribe
- Mute
- Subscribe to RSS Feed
- Permalink
- Notify Moderator
- Mark as New
- Bookmark
- Subscribe
- Mute
- Subscribe to RSS Feed
- Permalink
- Notify Moderator
And these two things I want to know:
1. The maximum value for Vout and Vin at each frequency range
2. The time values t2 and t1 when maximum Vout and maximum Vin are occuring for each frequency range
For each frequency range:
and so on..
- Mark as New
- Bookmark
- Subscribe
- Mute
- Subscribe to RSS Feed
- Permalink
- Notify Moderator
The spacing between frequencies:
From 0.001Hz to 0.01Hz:
From 0.01Hz to 0.1Hz:
and so on...till 1e6Hz
- Mark as New
- Bookmark
- Subscribe
- Mute
- Subscribe to RSS Feed
- Permalink
- Notify Moderator
From 0.1Hz to 1Hz:
- Mark as New
- Bookmark
- Subscribe
- Mute
- Subscribe to RSS Feed
- Permalink
- Notify Moderator
I do not know exactly:
For example for the frequencies between 0.001Hz to 0.01Hz, and for the first frequency: 0.001
(That I knew from Excel that from 0 to 1024 is 0.001)
So, from index 0 till index 1024 the frequency 0.001Hz is located.
And so on for the next frequency
Here, above, from index 1025 till index xxxx is located frequency of 0.001259.
And so on.
Then for the next range of frequencies: from 0.01 to 0.1,,,
Etc. A program like this I need...
- Mark as New
- Bookmark
- Subscribe
- Mute
- Subscribe to RSS Feed
- Permalink
- Notify Moderator
- Mark as New
- Bookmark
- Subscribe
- Mute
- Subscribe to RSS Feed
- Permalink
- Notify Moderator
- Mark as New
- Bookmark
- Subscribe
- Mute
- Subscribe to RSS Feed
- Permalink
- Notify Moderator
Thank you, ttokoro san
Its ok this (as you have posted first time, also in the above picture seen):
not i:=0...90 as you modified in Mathcad file, because in excel file the first line is started from 1, not from 0 as in Mathcad. Of course, we can change in Mathcad Origin to 1, but its ok even like that from 0. Thus we do not need to add this:
Also thanks for attached mathcad file, was more easy to understand.
I am not sure, but @Werner_E did you remember in what topic you made this Unique function, to see how this function came from, where was needed this function?
- Mark as New
- Bookmark
- Subscribe
- Mute
- Subscribe to RSS Feed
- Permalink
- Notify Moderator
I am not sure, but @Werner_E did you remember in what topic you made this Unique function, to see how this function came from, where was needed this function?
Sorry, I have no idea in which context and in which thread I posted that function. I even can't remember that I wrote it.
There is a typo in line 2 where R.index gets initialized ("ingex" instead of "index").
Actually I wonder why the function works anyway. I would have expected an error at the first call to stack(R.index. i) because R.index is undefined.
Using the same (undefined) variable on the RHS and on the LHS in combination with a loop seems to do the job.
It also works in Mathcad. Guess I never noticed that behaviour...
- Mark as New
- Bookmark
- Subscribe
- Mute
- Subscribe to RSS Feed
- Permalink
- Notify Moderator
- Mark as New
- Bookmark
- Subscribe
- Mute
- Subscribe to RSS Feed
- Permalink
- Notify Moderator
Use submatrix(matrix,1,last(x),0, 3)
My Prime 9 sheet add [1 1 1 10^7] to make No.90 plot.
Unique function was made Terry, Werner, etc. It select and find frequency block very smart programming.
- Mark as New
- Bookmark
- Subscribe
- Mute
- Subscribe to RSS Feed
- Permalink
- Notify Moderator
I am not sure where I do wrong...
OK
NOT ok:
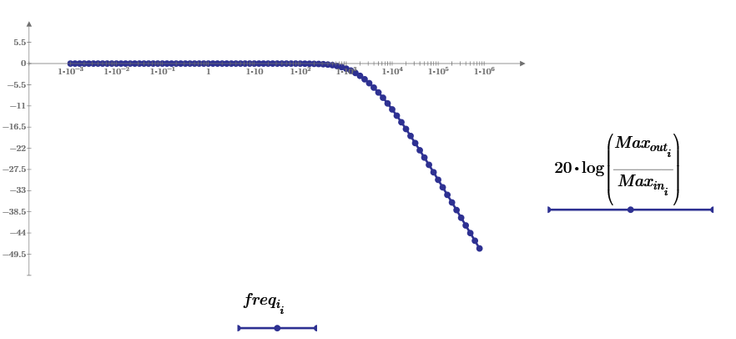
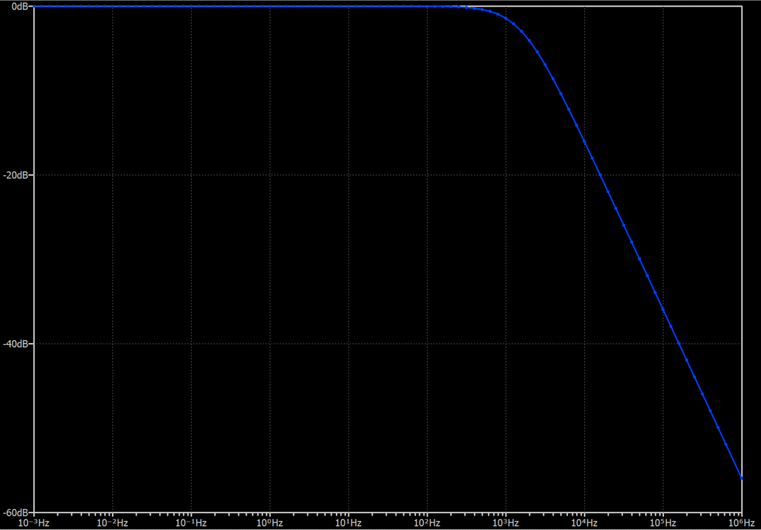
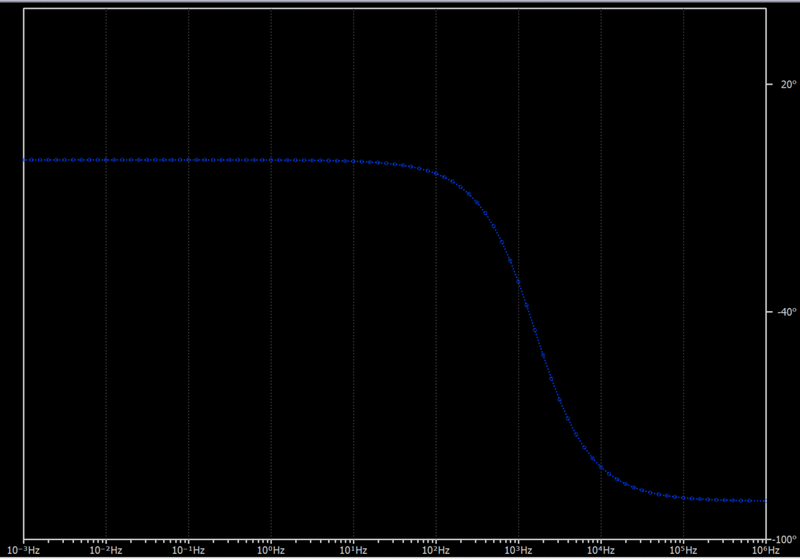
It should look like more like this picture:
- Mark as New
- Bookmark
- Subscribe
- Mute
- Subscribe to RSS Feed
- Permalink
- Notify Moderator
@ttokoro
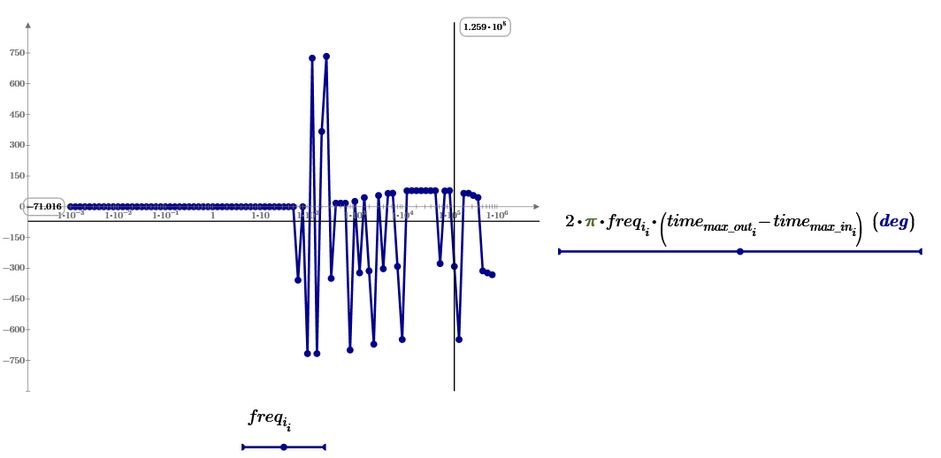
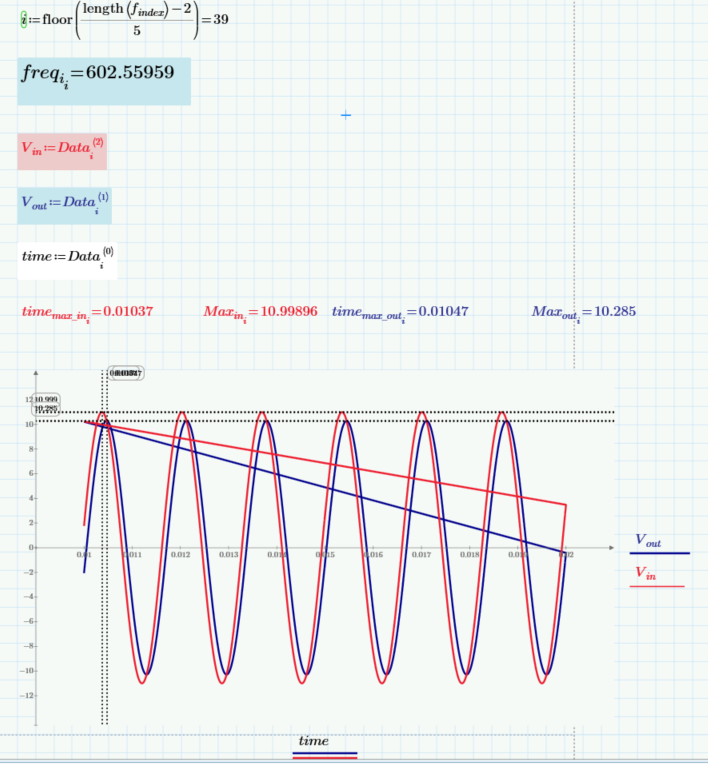
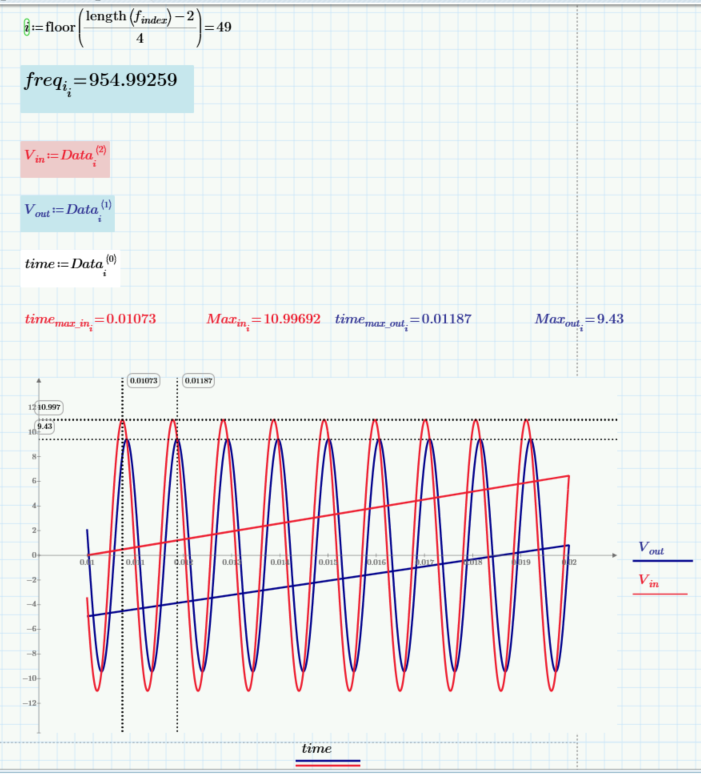
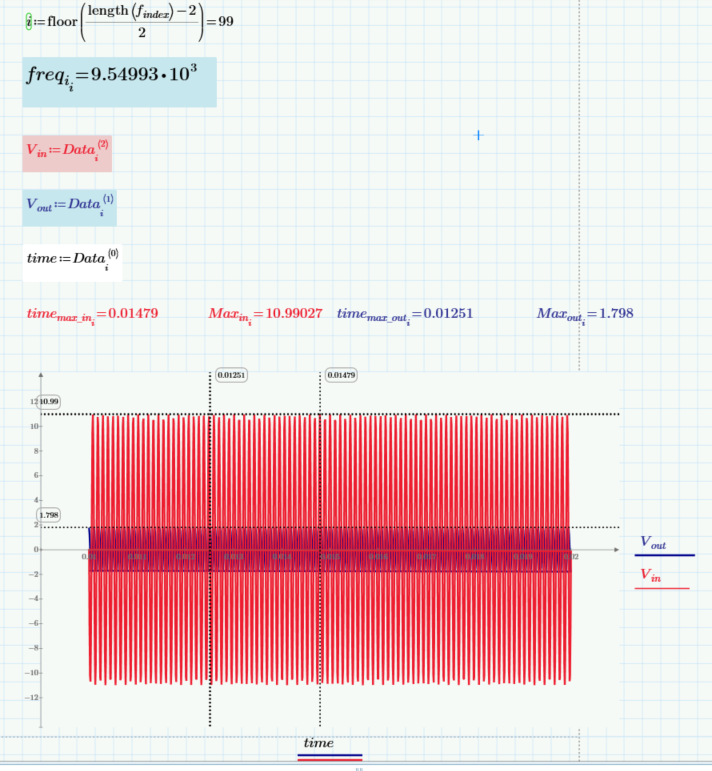
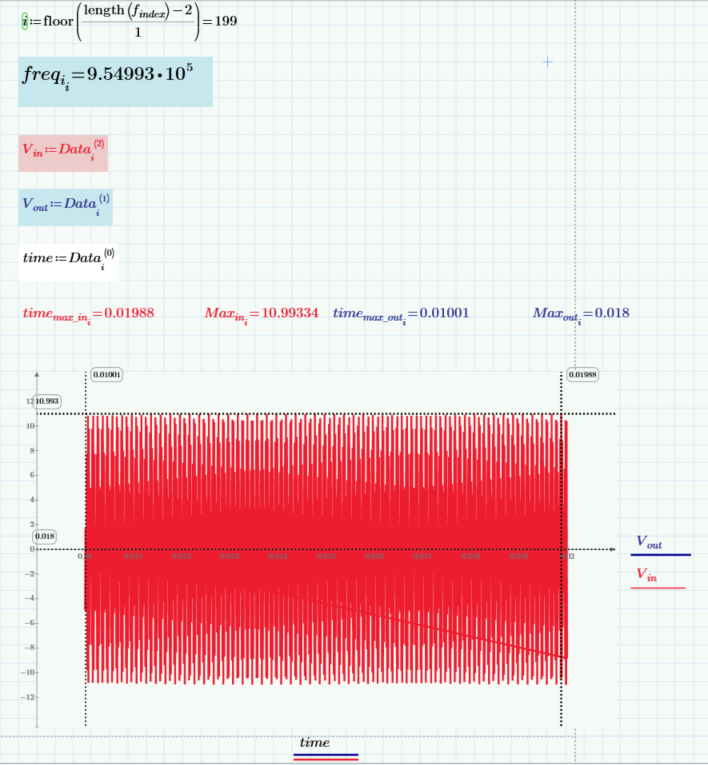
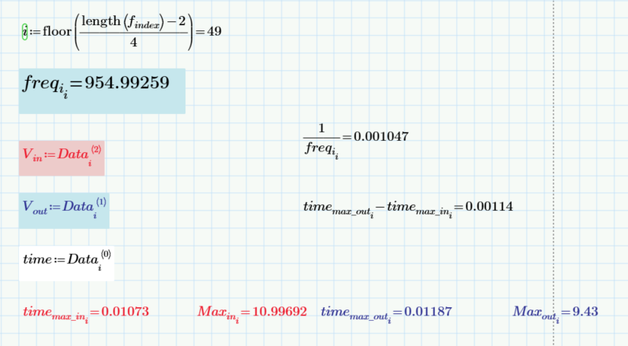
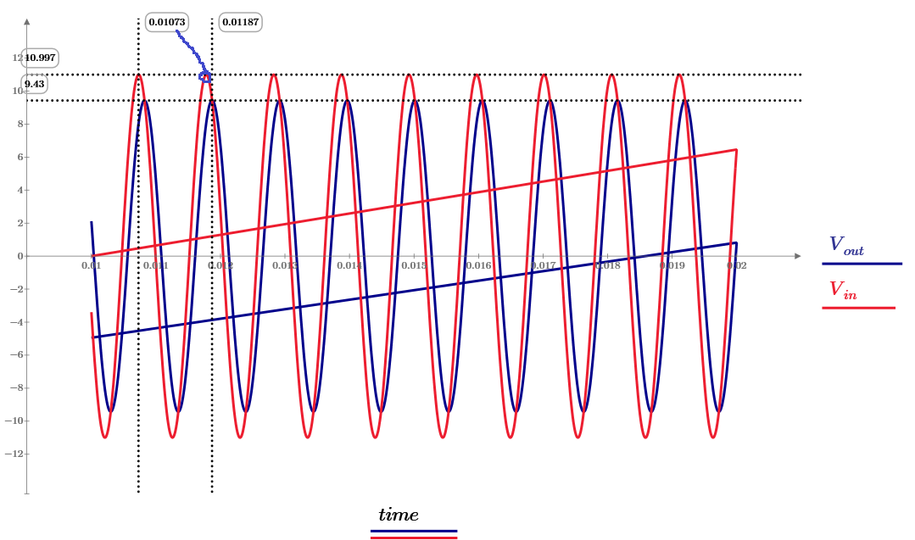
I am not sure why for higher frequencies the time_max_in_i and time_max_out_i its calculated at such long distance:
Good:
Bad:
- Mark as New
- Bookmark
- Subscribe
- Mute
- Subscribe to RSS Feed
- Permalink
- Notify Moderator
Excel file and Mathcad Prime 9 attached with data above. I think here its the problem, how these parameters are calculated:
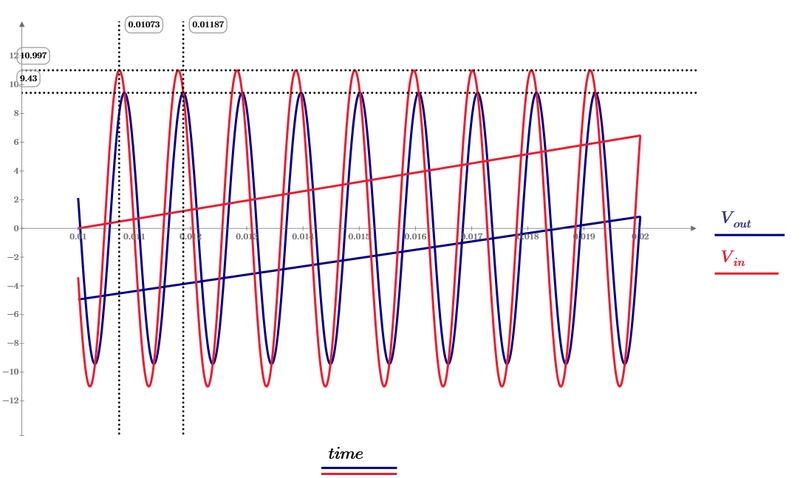
I am expected that time_max_out and time_max_in to be one after another calculated, as in the first photo GOOD for frequency of 602.55959
- Mark as New
- Bookmark
- Subscribe
- Mute
- Subscribe to RSS Feed
- Permalink
- Notify Moderator
- Mark as New
- Bookmark
- Subscribe
- Mute
- Subscribe to RSS Feed
- Permalink
- Notify Moderator
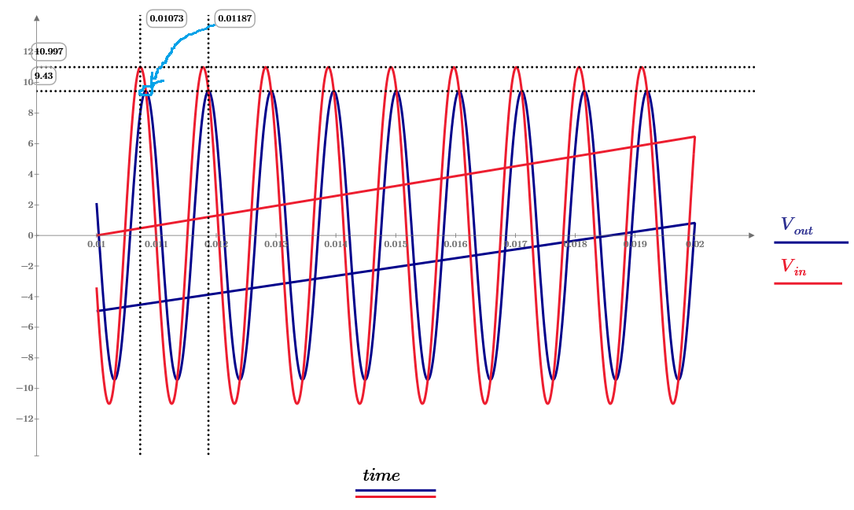
Or the max value for Vin to be here:
- Mark as New
- Bookmark
- Subscribe
- Mute
- Subscribe to RSS Feed
- Permalink
- Notify Moderator
So, something like that I think should be the case
- Mark as New
- Bookmark
- Subscribe
- Mute
- Subscribe to RSS Feed
- Permalink
- Notify Moderator
Can the program be made in such a way that the search for time_max_in at Max_in and time_max_out at Max_out to be made in such a way that |time_max_out - time_max_in|<=1/freq (sorry, I wrrite this message on the phone, but I hope is understandable)
Maybe a program that fiind each maximum value for Vout and Vin and each time_max_out and time_max_in for the respective maximum Vout and maximum Vin amplitudes, but for each period 1/freqi, and afterwards to choose maximum Vout amplitude/peak and time_max_out and maximum Vin amplitudes/peak and time_max_in satisfing also the condition that |time_max_out - time_max_in|<=1/freqi
But can be also other approaches...maybe more simpler
| | denote absolute value
- Mark as New
- Bookmark
- Subscribe
- Mute
- Subscribe to RSS Feed
- Permalink
- Notify Moderator
Page 1 to 2 is fixed. Data has no meaning i >100 because aliasing has occure.
- Mark as New
- Bookmark
- Subscribe
- Mute
- Subscribe to RSS Feed
- Permalink
- Notify Moderator
Using FFT, cspline interporation, etc.. I have tried to solve the problem,
Finaly, Solve block with parameterize the data block No. i of minerr function of V*sin(omega[i*t) get below plot.
Data[150 is sampling same phase and it does not shows the sine waveform.
Plot of Data[150.
Plot of Data[60 shows interpolated data as solid lines.
- Mark as New
- Bookmark
- Subscribe
- Mute
- Subscribe to RSS Feed
- Permalink
- Notify Moderator
Please attach also mathcad file
- Mark as New
- Bookmark
- Subscribe
- Mute
- Subscribe to RSS Feed
- Permalink
- Notify Moderator
Need many try and error to solve. But the answer is very symple one.
- Mark as New
- Bookmark
- Subscribe
- Mute
- Subscribe to RSS Feed
- Permalink
- Notify Moderator
Thank you very much, ttokoro san, I will look to it, and I will try to see
- Mark as New
- Bookmark
- Subscribe
- Mute
- Subscribe to RSS Feed
- Permalink
- Notify Moderator
I discovered something I don't like in the dataset. I have to review the dataset because it seems something irregular that I don't like in the dataset (excel file) at high frequencies. I'll post when I figure out the things I don't like
- Mark as New
- Bookmark
- Subscribe
- Mute
- Subscribe to RSS Feed
- Permalink
- Notify Moderator
The last my sheet is using all data points of each frequency. So asuming the data is sine wave, it is one of the best answer to get maximam voltage and its phase difference for Vin and Vout.


