
Turn on suggestions
Auto-suggest helps you quickly narrow down your search results by suggesting possible matches as you type.
Showing results for
Turn on suggestions
Auto-suggest helps you quickly narrow down your search results by suggesting possible matches as you type.
Showing results for
Options
- Subscribe to RSS Feed
- Mark Topic as New
- Mark Topic as Read
- Float this Topic for Current User
- Bookmark
- Subscribe
- Mute
- Printer Friendly Page
How to call values from a table and then do the minerr() calculation?
Jul 07, 2013
07:09 PM
- Mark as New
- Bookmark
- Subscribe
- Mute
- Subscribe to RSS Feed
- Permalink
- Notify Moderator
Jul 07, 2013
07:09 PM
How to call values from a table and then do the minerr() calculation?
Hi:
This is the reply I got from created by VladimirN. in Creo.
------------------------------------------------------------------------------------------------------------------------------------------------------------------------------------------------------------------------
This is a built-in Mathcad function. Minerr(var1, var2, ...) - returns the values of var1, var2, ..., coming closest to satisfying a system of equations and constraints in a Solve Block. Returns a scalar if only one argument, otherwise returns a vector of answers. If Minerr cannot converge, it returns the results of the last iteration.
-----------------------------------------------------------------------------------------------------------------------------------------------------------------------------------------------------------------------
I have two questions:
1) As I read the minerr() instruction, var1, var2, .. should be either integer or complex number.
Can var1, var2 be vectors?
2) Is there any way to call var1, var2 from a separated table and then put them into minerr()?
Solved! Go to Solution.
Labels:
- Labels:
-
Statistics_Analysis
1 ACCEPTED SOLUTION
Accepted Solutions
Aug 06, 2013
07:15 PM
- Mark as New
- Bookmark
- Subscribe
- Mute
- Subscribe to RSS Feed
- Permalink
- Notify Moderator
Aug 06, 2013
07:15 PM
Richard Jackson wrote:
speed up the calculation for a larger set of parameters
The time taken for non-linear least squares scales as the square of the number of residuals and as the square of the number of fitted parameters.
As I understand it Chih-Yu Jen will have 25 to be fitted parameters und a residual vector of approx. 1500 elements (or 3000 if real and imaginary parts are stacked as per your suggestion). Every try with a set of different parameters TT will have to call a function make_Theory(TT) which returns a vector of 1500 complex numbers. The method to gain those values is rather complex and would involve creating and multiplying 25 2x2 matrices for every single value of that vector. Some methods how are in this post http://communities.ptc.com/message/211040#211040 and the following (which is more compact, maybe a bit faster and has two errors (m-->M, n-->TT)).
So I think that speeding up make_Theory(TT) would help in speeding up the overall calculation.
Back in the days of mainframe computers that occupied an entire room and had 1/10000th of the processing power of my current smart phone, I ran some least squares optimizations that took two days to converge.

You are showing your age 
But two days would be fine, in a prior post in this thread, when Chih-Yu Jen sent some information about calc time with fewer parameters and smaller residual vector, I made an estimation that the calculation with the real values would take up three weeks or 5 and ahalf days with a minor improvement of mine. Not sure if that would have been true - think he didn't bother trying. Guess he will let us know how speedy we got in the meantime.
87 REPLIES 87
Jul 07, 2013
07:38 PM
- Mark as New
- Bookmark
- Subscribe
- Mute
- Subscribe to RSS Feed
- Permalink
- Notify Moderator
Jul 07, 2013
07:38 PM
For questions about Mathcad its always a good idea to state which version you are using and its always helpful to attach a worksheet which shows what you have done so far.
Unless otherwise stated Mathcad 15 is assumed
1) As I read the minerr() instruction, var1, var2, .. should be either integer or complex number.
Can var1, var2 be vectors?
Yes. The help calls it "array variables".
2) Is there any way to call var1, var2 from a separated table and then put them into minerr()?
Not sure what you mean. You can "call" a function, but not a variable. But the variables can be from any place any other MC variables can ste from - a matrix ("table"?) in the same sheet, from an extern Mathcad sheer or even read in from a CSV or an Excel file.
EDIT: I just had a glance at the thread you are coming from and it seems to me that you misunderstand what "Minerr" would do. You can provide guess values for the variables which should be varied, you may add some constraints but you cannot force Mathcad to consider only values for these variables from a given set of data. Maybe you should give the help a second look and also the quicksheet it referrs to.
What I understood from that post of yours is, that you have a set/vector of X-values and you want to chose any five of them to put them as parameters in function you have defined and a looking for that set of five values for which the function result is closest to a given value.
It looks to me that it needs a self written function to accomplish that.
But then I may be wrong as its not really fully clear to me what you are really after. Think you should post a worksheet and show by example what you are trying to accomplish.
Jul 07, 2013
08:21 PM
- Mark as New
- Bookmark
- Subscribe
- Mute
- Subscribe to RSS Feed
- Permalink
- Notify Moderator
Jul 07, 2013
08:21 PM
Hi:
I hope you can see the below Excel table I posted (also imported to MathCad) and I use MathCad 15.
As you can see, X axis is 1E15, 2E15... and Y axis is frequency (0.3, 0.35....).
1,2,3... is the data.
For the question 1, the var1, var2...I paln to use inside minerr() are the data in 1E15, 2E15.....columns (data: 1,2,3..)
For example, if I define 1E15, 2E15, 3E15 and 4E15 columns as variables, data (1,1,1,1 in frequency 0.3), data (2,2,2,2 in frequency 0.35) will do the calculation separately and then come out a data column like the "t" columnat right side of the table. The calculated "t" column will compare with the measured "t" column in minerr() to find the minimun error.
So you say it can work by using array variables, right?
For the question 2 (I guess it is similar to question 1), my plan is to choose data from this table in each loop (for example, select 1E15==> data in 1E15 column will be used) and then use minerr() to find the variables (say 4 variables) with a minimun error.
In all examples I read, the initial guess value (integer or complex number) is defined first and then LMA in minerr() will determine proper values to find minimum error.
To me, is there any way to select data ( data column) from this table in each loop (this is what I mean "call") and then put them into minerr() to determine proper variable (say 1E15, 3E15, 5E15 and 8E15)?
Since the variables (var2, var2,...) I plan to use are data column, should I use vectors as guess values?
Maybe the table I import shouldn't contain X/Y axis (I am new to the programming).
| Frequency | 1E+15 | 2E+15 | 3E+15 | 4E+15 | 5E+15 | 6E+15 | 7E+15 | 8E+15 | 9E+15 | Frequency | t | |||
| 0.30 | 1 | 1 | 1 | 1 | 1 | 1 | 1 | 1 | 1 | 0.30 | 1 | |||
| 0.35 | 2 | 2 | 2 | 2 | 2 | 2 | 2 | 2 | 2 | 0.35 | 2 | |||
| 0.40 | 3 | 3 | 3 | 3 | 3 | 3 | 3 | 3 | 3 | 0.40 | 3 | |||
| 0.45 | 4 | 4 | 4 | 4 | 4 | 4 | 4 | 4 | 4 | 0.45 | 4 | |||
| 0.50 | 5 | 5 | 5 | 5 | 5 | 5 | 5 | 5 | 5 | 0.50 | 5 | |||
| 0.55 | 6 | 6 | 6 | 6 | 6 | 6 | 6 | 6 | 6 | 0.55 | 6 | |||
| 0.60 | 7 | 7 | 7 | 7 | 7 | 7 | 7 | 7 | 7 | 0.60 | 7 | |||
| 0.65 | 8 | 8 | 8 | 8 | 8 | 8 | 8 | 8 | 8 | 0.65 | 8 | |||
| 0.70 | 9 | 9 | 9 | 9 | 9 | 9 | 9 | 9 | 9 | 0.70 | 9 | |||
| 0.75 | 10 | 10 | 10 | 10 | 10 | 10 | 10 | 10 | 10 | 0.75 | 10 | |||
| 0.80 | 11 | 11 | 11 | 11 | 11 | 11 | 11 | 11 | 11 | 0.80 | 11 | |||
| 0.85 | 12 | 12 | 12 | 12 | 12 | 12 | 12 | 12 | 12 | 0.85 | 12 | |||
| 0.90 | 13 | 13 | 13 | 13 | 13 | 13 | 13 | 13 | 13 | 0.90 | 13 | |||
| 0.95 | 14 | 14 | 14 | 14 | 14 | 14 | 14 | 14 | 14 | 0.95 | 14 | |||
| 1.00 | 15 | 15 | 15 | 15 | 15 | 15 | 15 | 15 | 15 | 1.00 | 15 |
Jul 07, 2013
08:29 PM
- Mark as New
- Bookmark
- Subscribe
- Mute
- Subscribe to RSS Feed
- Permalink
- Notify Moderator
Jul 07, 2013
08:29 PM
Hi:
I just found you have the following typing "EDIT"
The idea you described is correct.
-------------------------------------------------------------------------------------------------------------------------------------------------------------
What I understood from that post of yours is, that you have a set/vector of X-values and you want to chose any five of them to put them as parameters in function you have defined and a looking for that set of five values for which the function result is closest to a given value.
--------------------------------------------------------------------------------------------------------------------------------------------------------------
My plan is to let minerr() to determine that set of five values.
Are you saying there is no way to use minerr() and needs a self written function (means I have to write LMA by myself) to achieve my goal?
Jul 08, 2013
05:07 AM
- Mark as New
- Bookmark
- Subscribe
- Mute
- Subscribe to RSS Feed
- Permalink
- Notify Moderator
Jul 08, 2013
05:07 AM
Now I think I didn't understand what you are after at all.
Guess it would be necessary to post the definition of the function you want to fit and a concrete example (and I think the sample data you had chosen is not that helpful as of the equal columns.
First I thought that you have a function with 5 parameters and are searching the quintupel out of a given set of numbers which comes closest to a given result.
But this seems not to be case. Now it looks like you have a function of two parameters (X,Y) which you don't know analytically but only from tabled values. So do you look for some kind of interpolation?
You will have to formulate at least one equation you want to be fulfilled as close as possible.
Jul 08, 2013
09:18 AM
- Mark as New
- Bookmark
- Subscribe
- Mute
- Subscribe to RSS Feed
- Permalink
- Notify Moderator
Jul 08, 2013
09:18 AM
As you didn't provide a function which takes the five vectors you are talking about and result a vector which should be close to the given one, I played around with what you have provided so far. Look at the attched if there is something which may help you deriving your own worksheet.
In that sheet I show how to find the (interpolated) column of your data table (that is: the interpolated x-value) which fits the given t-vector best.
With the testfile you provided all columns are equal and so you would get as a result the guess value itself all the time. So I changed your testdata using random numbers.
Jul 08, 2013
12:24 PM
- Mark as New
- Bookmark
- Subscribe
- Mute
- Subscribe to RSS Feed
- Permalink
- Notify Moderator
Jul 08, 2013
12:24 PM
Hi Werner:
I have to say "thanks a lot" bcz you even write a code for me to start.
The "lookup function" should be the one I am looking for and I am studying how to use it.
The goal for me is a little bit different....
The data in the table I provided (X,Y) is also the measurement result. Therefore I need to lookup and use them, not change them.
The equation I use is a transfer matrix quation t=M, where "t" will be the calculated "t" (the one I want to put into minerr() to compare with measured "t" and find the minimum error) and M is a term containing 5 parameters.
As I said before, once I define 5 parameters (initial guess value, each one is a column data), the first row of 5 data (frequency 0.3) will be inserted into M (called M1) and then come out t (called t1).
Then t2, t3,.......tN will be calculated for form the vector of calculated "t".
This calculated "t" vector will be compared with the measured "t" vector inside minerr() through LMA (or other algorithm).
My original concept is that minerr() can automatically lookup the next 5 parameters and then repeat the same process until the minimum error is found.
But someone said minerr() can only do the internal calculation once the guess value is defined (like your code) and cannot do what I want (automatically lookup the next 5 parameters from the same table).
Is that answer correct?
Therefore I think I may not be able to use the minerr().
Maybe I have to write some kind of code containg minerr() concept.
For example: change 1st parameter only (other 4 parameters fixed) to define the best 1st parameter with small error. Then change 2nd parameter only (other 4 parameters fixed) to define the best 2nd parameter. Repeat this process until the determination of the 5th parameter.
If I can just use minerr() to finish the whole work, that will be the best to me.
Jul 08, 2013
01:55 PM
- Mark as New
- Bookmark
- Subscribe
- Mute
- Subscribe to RSS Feed
- Permalink
- Notify Moderator
Jul 08, 2013
01:55 PM
The data in the table I provided (X,Y) is also the measurement result. Therefore I need to lookup and use them, not change them.
Does that mean that you don't need/want any interpolation to be done? So what should your lookup function return, if called with x=4.5*10^15 and y=0.57? An error message or better NaN?
The equation I use is a transfer matrix quation t=M, where "t" will be the calculated "t" (the one I want to put into minerr() to compare with measured "t" and find the minimum error) and M is a term containing 5 parameters.
So why don't you post a WS with that equation? It's impossible for me to guess from your description.
My original concept is that minerr() can automatically lookup the next 5 parameters and then repeat the same process until the minimum error is found.
But someone said minerr() can only do the internal calculation once the guess value is defined (like your code) and cannot do what I want (automatically lookup the next 5 parameters from the same table).
Is that answer correct?
I fear yes. As I already wrote earlier it seemed to me you misunderstood how minerr() would work. You have no control over what values for the parameters the algorithm would try next, but then thats inherent to the LMA anyway.
Therefore I think I may not be able to use the minerr().
Thats possible, but can be decided only when we see what you are really after.
Maybe I have to write some kind of code containg minerr() concept.
For example: change 1st parameter only (other 4 parameters fixed) to define the best 1st parameter with small error. Then change 2nd parameter only (other 4 parameters fixed) to define the best 2nd parameter. Repeat this process until the determination of the 5th parameter.
This would have nothing to do with Levenberg-Marquardt or any other algorithm used in minerr.
I am still confused what parameters you would like to change. But if I assume that you do not need/want any interpolation there would in any case only be a limited number of combination to try.
So, to stay with your sample data, it the nine X-values you want to chose five from, you would have 9 over 5 times 5! (beacuse different order may give different results, right?) This would mean roughly 15000 times calculating the SSE and keeping the combination with the samllest SSE (Sum of Squared Errors). I have assumed that you want five _different_ X-values but am not sure if that would apply.
As of the algo you proposed: If a first parameter sems to be optimal in combination with any other 4 parameters does not mean its the overall optimal first parameter.
So we are waiting for your sheet which hopefully should clarify things
Jul 08, 2013
03:16 PM
- Mark as New
- Bookmark
- Subscribe
- Mute
- Subscribe to RSS Feed
- Permalink
- Notify Moderator
Jul 08, 2013
03:16 PM
Hi Werner:
Your answer is so quick and makes my thinking more clear.
1) About the interpolation question:
Originally I think I should expand 9 measured X-values to 50 X-values through interpolation and setup them as the library first. Then use minerr() to lookup the data in each loop.==> Now you already tell me it won't work bcz minerr() doesn't allow me to control over what values for the parameters the algorithm would try next.
Instead, you tell me that the interpolation code might be able to follow the trend line of 9 measured X-values and by doing this way minerr() can be used.
I think this is your message to this part.
2) It's a shame that I cannot attache the worksheet. I only find the place to attach the picture and video.
The equation is quite simple (I guess). Let me type it this way:
ti=2/(M(0,0)i+M(1,0)i+M(0,1)i+M(1,1)i),
i=1,2,3....n as a function of frequency (column vector) (Data in each frequency should be calculated separately)
M=M1*M2*M3*M4*M5, M1...M5 are 2X2 matrixs and each matrix contain 1 parameter.
M(0,0) is the upper-left term in the matrix and others are terms in other 3 locations.
ti is the calculated "t". If we setup ti as (calcualted "t"- measured "t"), it becomes the error.
3) In my another thinking, actually I want to expand 9 measured X-values to 50 X-values. Although I can constrain X1>X2>X3>X4>X5, I realized that there are too many combination to calculate.
Maybe it's not a good idea.
If my above understanding is correct, I still can use minerr() and no need to consider this way/
Jul 08, 2013
02:18 PM
- Mark as New
- Bookmark
- Subscribe
- Mute
- Subscribe to RSS Feed
- Permalink
- Notify Moderator
Jul 08, 2013
02:18 PM
Hi Werner:
By looking at your code clearly, I think maybe your code does exactly the same thing as I expect but not sure.
Let me ask some questions:
1) You changed my testdata using random number and then used below code to interpolate something.)
Is that the reason that the value of 4E15 column in the testdata (Excel) is different from the 4E15 column in the Mathcad? If yes, I don't want to change the original data I put in the table.
2) My testdata doesn't have 4.5E15 column but your code generates it. If my guessing is correct, maybe above code is doing my another goal: library data expansion.
That means I don't want to change the original data but I do want to interpolate more data in between, like 4.5E15 column, 4.5E15 column, 4.6E15 column...... .
But the weird thing to me is that: why is the 1st value (2.362) in the 4.5E15 column bigger than others (1.977 and 1.819)? If that is a interpolation, the value should be somewhere between 1.819 and 1.977, correct?
3) Below code shows me guess value can be a vector. thanks!!
My thinking is that:
Once the library expansion is achieved, I am hoping to lookup data column from the library in each loop and find out the cloest parameter like xmin. Maybe it is possible to obtain x1...x5 at the same time if I define the equation correct.
But in your minerr() code, it looks to me that only the initial guess value is chosen from the table.
How does minerr() determine each value inside the 5.484E15 column?
Interpolation from the given table?
Jul 08, 2013
02:44 PM
- Mark as New
- Bookmark
- Subscribe
- Mute
- Subscribe to RSS Feed
- Permalink
- Notify Moderator
Jul 08, 2013
02:44 PM
By looking at your code clearly, I think maybe your code does exactly the same thing as I expect but not sure.
I can hardly image that
1) You changed my testdata using random number and then used below code to interpolate something.
)
Is that the reason that the value of 4E15 column in the testdata (Excel) is different from the 4E15 column in the Mathcad? If yes, I don't want to change the original data I put in the table.
If you are talking about the function f_look: It interpolates so you can ask for a data value for X- and Y-values which are not in the measured values provided. You can change the filename at the top of the sheet to load in your original Excel file. But interpolation does not make much sense if all the values are identical.
2) My testdata doesn't have 4.5E15 column but your code generates it. If my guessing is correct, maybe above code is doing my another goal: library data expansion.
That means I don't want to change the original data but I do want to interpolate more data in between, like 4.5E15 column, 4.5E15 column, 4.6E15 column...... .
Correct. thats the interpolation. You should get the original tabled values unchanged if you feed the function with the X- and Y-values from your table. I'll have a look why some interpolated values are not inbetween.
Once the library expansion is achieved, I am hoping to lookup data column from the library in each loop and find out the cloest parameter like xmin. Maybe it is possible to obtain x1...x5 at the same time if I define the equation correct.
?? Hopefully a sheet will clarify this.
But in your minerr() code, it looks to me that only the initial guess value is chosen from the table.
How does minerr() determine each value inside the 5.484E15 column?
Interpolation from the given table?
Correct, thats exactly the reason we need the interpolation function so we can formulate an equation which Minerr() can work on.
Jul 08, 2013
03:22 PM
- Mark as New
- Bookmark
- Subscribe
- Mute
- Subscribe to RSS Feed
- Permalink
- Notify Moderator
Jul 08, 2013
03:22 PM
Hi Werner:
Based on you code, I guess all I need to modify are:
1) Make sure the interpolation part code can interpolate column vector based on the original 9 measured X-values.
2) Setup 5 guess values, then wirte the equation ti=2/(M(0,0)i+M(1,0)i+M(0,1)i+M(1,1)i) into the code, use xmin=Minerr(var1,var2,var3,var4,var5) to determine 5 variables.
Correct?
Jul 08, 2013
04:03 PM
- Mark as New
- Bookmark
- Subscribe
- Mute
- Subscribe to RSS Feed
- Permalink
- Notify Moderator
Jul 08, 2013
04:03 PM
Correct?
I can't tell as I am still in doubt about what you want to achieve at the and and I still don't see a worksheet.
I wonder why M is a 2x2 matrix and not a 4x1 vector - the denominator could be written as a simple dot product that way.
Just give it a try a begin to use Mathcad.
Jul 08, 2013
03:58 PM
- Mark as New
- Bookmark
- Subscribe
- Mute
- Subscribe to RSS Feed
- Permalink
- Notify Moderator
Jul 08, 2013
03:58 PM
Here is the promised explanation why sometimes the interpolated values are not between the given "anchor" values.
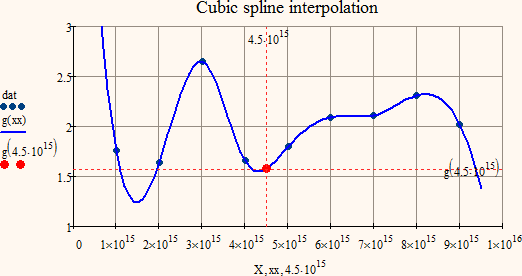
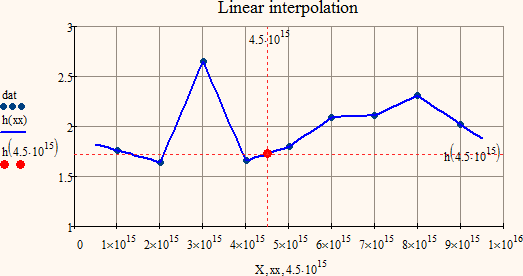
Main reason for this is because I used cubic spline interpolation and not just a linear interpolation between two adjacent points only. Usually spline is to be preferred but of course it depends uponb what you would like to achieve and what your data is. If the data is in ascending or descending order the effect won't show either.
For whatever it may be worth I added linear interpolation to the worksheet you find attached.
I have created a 2-dimensional example to demonstrate the difference and how this effect arises.
Spline: f(4.5*10^15) is smaller than both f(4*10^15) and f(5*10^15)
Linear interpolation
Message was edited by: Werner Exinger
Jul 09, 2013
11:10 AM
- Mark as New
- Bookmark
- Subscribe
- Mute
- Subscribe to RSS Feed
- Permalink
- Notify Moderator
Jul 09, 2013
11:10 AM
Hi Werner:
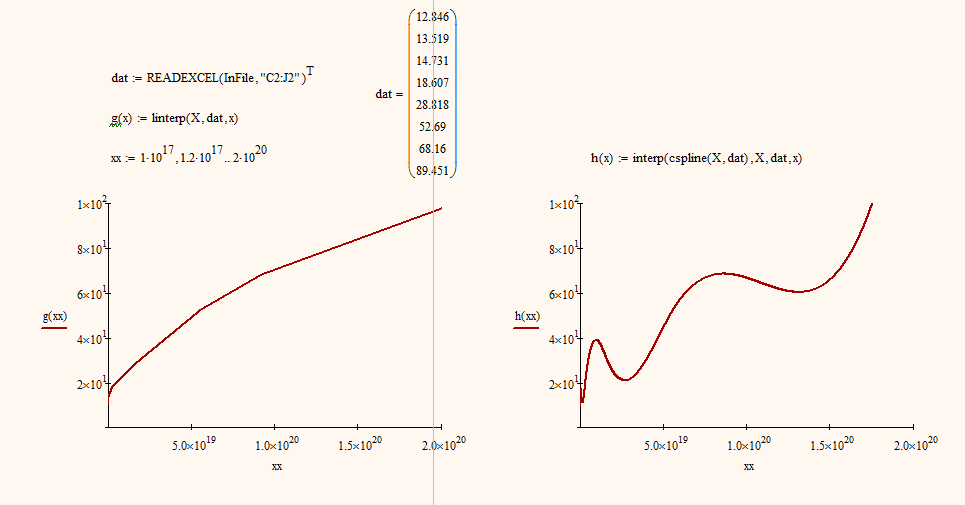
I tried the ascending order data using linear/cubic interpolation.
It looks to me that the effect (oscillation) exists.
I think I might use linear interpolation for me data. Thank you.
One important thing to ask:
When minerr() internally chooses the next value set, will it follow the linear/cubic interpolation rule?
If the answer is yes, I think I should be able to use this function for my work.
Jul 09, 2013
12:31 PM
- Mark as New
- Bookmark
- Subscribe
- Mute
- Subscribe to RSS Feed
- Permalink
- Notify Moderator
Jul 09, 2013
12:31 PM
When minerr() internally chooses the next value set, will it follow the linear/cubic interpolation rule?I
I don't see any minerr() solveblock in your pic. Why should minerr() do that? Minerr will vary its parameters according to the algorithm chosen, probably chosing smaller increments if SSE gets smaller. It will not follow any given function to chose the values. The chosen values are then put in the equation(s) you provide and the SSE is calculated again.
concerning the interpolation: you could try pspline or lspline instead of cspline, but probably the oscillation will persist. You don't show the values of X but it seems that you have a huge range there. Maybe a logarithmic scale would be an option.
Depending on the purpose an approximation probably is better suited than an interpolation. You may lookup the various regressions and chose the function which fits best (which will be dependent on your work - you will know if you have to expect a polynomial relation or a logarithmic one or whatever).
Jul 09, 2013
01:26 PM
- Mark as New
- Bookmark
- Subscribe
- Mute
- Subscribe to RSS Feed
- Permalink
- Notify Moderator
Jul 09, 2013
01:26 PM
Thanks!!
I think you answered my question, which is that minerr() won't follow the linear interpolation to choose the next parameter set.
The picture I showed didn't include the minerr(). I just demo the interpolation result based on my data.
But this part code is helpful to me bcz I have to expand the database anyway.
I think I have to figure out a way to utilize the minerr() (Ex: use minerr() to find out xmin, then see what's the cloest x to xmin in the database) or other ways without using minerr().
Jul 09, 2013
04:58 PM
- Mark as New
- Bookmark
- Subscribe
- Mute
- Subscribe to RSS Feed
- Permalink
- Notify Moderator
Jul 09, 2013
04:58 PM
I just realized that I must have overlooked a posting of you where you stated that you are not able to attach your worksheet.
You have to click "Use advanced editor" . At the end of your post you will find the option to attach files.
Alternatively you can just post normally and then click "Edit". This lets you edit your post (what else) and you are automatically in advanced editor.
Maybe this will shed some light on your objective function with the five parameters and the t-vector as a result.
Jul 09, 2013
02:25 PM
- Mark as New
- Bookmark
- Subscribe
- Mute
- Subscribe to RSS Feed
- Permalink
- Notify Moderator
Jul 09, 2013
02:25 PM
Minerr will vary its parameters according to the algorithm chosen, probably chosing smaller increments if SSE gets smaller.
The LM algorithm adaptively changes step size, although it's based on rate of convergence rather than the actual value of the SSE.
It will not follow any given function to chose the values.
Yes and no. It follows a local quadratic approximation to the objective function (a truncated Taylor expansion).
Like you, I don't really understand what's wanted here. I think it's the best set of five "parameters" from the available vector of values, in which case minerr will not be of any use. Neither will any other built-in function. As you noted above, the solution would be to write a program that does an exhaustive search of all the possibilities.
Jul 09, 2013
04:14 PM
- Mark as New
- Bookmark
- Subscribe
- Mute
- Subscribe to RSS Feed
- Permalink
- Notify Moderator
Jul 09, 2013
04:14 PM
Thanks for clarifying my incorrect description of the LMA.
Like you, I don't really understand what's wanted here. I think it's the best set of five "parameters" from the available vector of values, in which case minerr will not be of any use.
Yes, thats what I thought, too. But then the interpolation seems to be appreciated, too. And the objective function which should depend on the five parameters never was fully revealed.
Lets see if this thread will come to a happy end.
Jul 09, 2013
05:32 PM
- Mark as New
- Bookmark
- Subscribe
- Mute
- Subscribe to RSS Feed
- Permalink
- Notify Moderator
Jul 09, 2013
05:32 PM
Thanks for clarifying my incorrect description of the LMA.
Actually, typing speed exceeded brain speed there. It's a quadratic approximation to the Chi square function, not the objective function (obviously perhaps, when thinking about it, since the algorithms look for the minimum of the Chi square function).
Another thought on finding the best set of five parameters. For a small total number of parameters (as in this case) an exhaustive search will work, and is guaranteed to find the optimal solution. For a large ttoal number it will be prohibitively slow though. A good approach then would be simulated annealing. Back in the days of MC11 that was available as a built-in function if you had the Numerical Recipes function pack, but unfortunately it's not available since then  .
.
Jul 10, 2013
07:01 AM
- Mark as New
- Bookmark
- Subscribe
- Mute
- Subscribe to RSS Feed
- Permalink
- Notify Moderator
Jul 10, 2013
07:01 AM
If you still need help post the worksheet as described here http://communities.ptc.com/message/208839#208839
(chose "Use advanced editor" at the upper right).
Especially how the five matrices M1..M5 depend on the five parameters and where these parameters should be taken from. Also info if these parameters have to be all different and in ascending order.
Jul 31, 2013
08:56 PM
- Mark as New
- Bookmark
- Subscribe
- Mute
- Subscribe to RSS Feed
- Permalink
- Notify Moderator
Jul 31, 2013
08:56 PM
Hi:
I have worked in the recent days to come out this initial code.
In this code:
1) Import the file Measure.XLSX which contains 9x1325 database.
2) Use linear interpolation to expand the database and use f_look to choose arbitrary columns in between.
3) Setup 26 initial variables (TTs)
4) These 26 TTs will look up the database to form 26 n's
5) Unitilize these 26 n's to obtain Theory_t and compare with Meaure_t
Now I have proved that the right TTs can give a well overlapped Theory_t and Meaure_t.
My question is: If I choose arbitrary TTs, how can I use minerr() to obtain the right TTs?
My thinking is: minerr(TTs) should be able to find the cloest Theory_t to Meaure_t. The obtained TTs will be close to measured TTs.
During the process, step 4/5 will be repeated again and again until the cloest Theory_t to Meaure_t is found.
I have setup err2G as the sum of the difference bew Theory_t and Meaure_t and then use minerr() to determine Fitted_N (the calculated vector of TTs) based on CN (the vector of initial TTs).
Now the result shows that Fitted_N is always equal to CN (calculated TTs = initial TTs).
But my goal is that Fitted_N is equal to measured TTs.
I know there is are problems in this code but don't know how to fix them.
Can anyone provide a hint?
Jul 31, 2013
09:39 PM
- Mark as New
- Bookmark
- Subscribe
- Mute
- Subscribe to RSS Feed
- Permalink
- Notify Moderator
Jul 31, 2013
09:39 PM
I have no clue what you are doing in this file.
What I can spot without the EXCEL data is, that you have not defined the function M.0() to M.25(), so I wonder where the pictures of the plots stem from.
Some additional ideas:
- Wouldn't it be easier to write T:=stack(1.49*10^19, 1.93*10^19,.....) ?
- Why don't you make n a 2-dimensional array? You could then create a range var j:=0..25 and write n[i,j:=f(TT[j,Y[i)..... and instead of n.4 you would use n<4> where <4> is the column selector.
Jul 31, 2013
10:00 PM
- Mark as New
- Bookmark
- Subscribe
- Mute
- Subscribe to RSS Feed
- Permalink
- Notify Moderator
Jul 31, 2013
10:00 PM
To you ideas:
1) Yes. stack or vector is easier. I am a beginning programer. As you can see, my code is kind of stupid looking. For now my goal is to make it work. Then I will consider to make it perfessional.
2) For the 2-dimensional array, I think it will work too. I just don't know many advaned coding methods.
For the file, I took out the defined function M.0() to M.25() and directly post the result from the complete code.
M.0() to M.25() are just simple 2x2 matrixs as a function of n's.
I am embarrassing of this because my advisor might not allow me to show the complete thing (but I have to work for this by myself).
In the current code, I only can prove that if I setup correct TTs (based on the measured result), I can obtain a well overlapped theroy_t/measure_t.
Now the question to me is: if I setup initial (arbitrary) TTs, can I obtain calculated TTs (close to measured TTs) through minerr().
The initial TTs or minerr() defined TTs should look up the database to generate n's, calculate M.0() to M.25() and then compare the error between as well as theroy_t/measure_t.
My original question is: Is MathCad capable to do this process? Any hint will be appreciated.
Aug 01, 2013
04:44 AM
- Mark as New
- Bookmark
- Subscribe
- Mute
- Subscribe to RSS Feed
- Permalink
- Notify Moderator
Aug 01, 2013
04:44 AM
I understand, so it will be only possible to give hints.
You should turn most of your calculations into functions of TT and it would be much easier to use vector notation,not dealing with individual elements (one equation versus 26!)
For MinErr you would need a (vector) function which has TT as parameter, similar to your err2G(), while I am not sure what you intend to do with the parameter CN, its never used.
You may look in the help (search "Minerr") for the quicksheet (sminerr.xmcd), alpha and beta would represent your 26 TT's and so it would be much more preferrable to use vector notation.
BTW, I don't see much of the problem you described earlier - chosing 5 "best" parameters out of a given set.
See attached for a slight first step
EDIT: changed the file and added some corrections
Aug 01, 2013
10:05 AM
- Mark as New
- Bookmark
- Subscribe
- Mute
- Subscribe to RSS Feed
- Permalink
- Notify Moderator
Aug 01, 2013
10:05 AM
Hi:
I have reading through the example.
Like you said, I need to setup functions of TT to generate theory_t as a vactor.
At the same time I also need to define measure_t as a vector.
Finally I need to define "measure_t-theory_t=0" to use minerr(TTs).
To define functions of TT, my sequence will be TTs->n's (look up from the file database containg linear interpolation)->Ms->Big M->theory_t.
Two question:
1) Do you mean that when minerr() internal deternine the next set TTs, the above sequence will be repeated again and again until the minimum error is founded?
2) The example code is very straight forward. I mean there is no complex structure (loop, if.....). Do you think my goal can be done without any complex structure?
I always think there should be something complicated inside because I want n's be formed from the file database containg linear interpolation.
Aug 01, 2013
10:30 AM
- Mark as New
- Bookmark
- Subscribe
- Mute
- Subscribe to RSS Feed
- Permalink
- Notify Moderator
Aug 01, 2013
10:30 AM
Not sure if you have noticed that I changed the attached file in the foregoing post (now with a _3 at the end). The one with the _2 had an error, maybe there still are some in as in lack of the Excel data and the formula for M.k() I only see red errors and have to work somewhat blindfolded.
Finally I need to define "measure_t-theory_t=0" to use minerr(TTs).
Either this or use the sum of squared as you had defined. But the LM algorithm does its own squaring and summing the residuals, so you should just use the difference vector as you wrote.
Two question:
1) Do you mean that when minerr() internal deternine the next set TTs, the above sequence will be repeated again and again until the minimum error is founded?
Basically yes. Minerr() will by default use the Levenberg-Marquardt algorithm (which usually is a good choice anyway) to "jiggle" the elements of the vector TT until it thinks it has found the minimum error. Its a numerical algorithm and so it has its flaws and drawbacks. It may depend on the guess values if a fit is found at all and how good it is. Also there is a chance of numerical inaccuracies making the result useless or avoiding a convergence. Sometime scaling the data would be necessary,...
2) The example code is very straight forward. I mean there is no complex structure (loop, if.....). Do you think my goal can be done without any complex structure?
I always think there should be something complicated inside because I want n's be formed from the file database containg linear interpolation.
You will probably have one or more loops in the definition of "make_M_sum()" which, as I see it, is the only part missing in the sheet now (apart from graphing at the end). And yes, I think it could be done that way. And it only looks less complex now because we got rid of addressing the single variables TT.i, n.i and (hopefully) M.i and used vector notation instead - the underlying complexity still remains. Your n-values ARE constructed using the two interpolating fuctions f() and g() you had setup. You would have to use the result of make_n() in the routine which deals with your M's (I suggestes make_MSum() in the sheet). Without knowing about your data and the way your M's are built its hard to say if you will have success. At least I guess that the iteration process will take quite some time - dealing with 26 parameters to play with is probably not that easy.
Aug 04, 2013
10:52 AM
- Mark as New
- Bookmark
- Subscribe
- Mute
- Subscribe to RSS Feed
- Permalink
- Notify Moderator
Aug 04, 2013
10:52 AM
Hi:
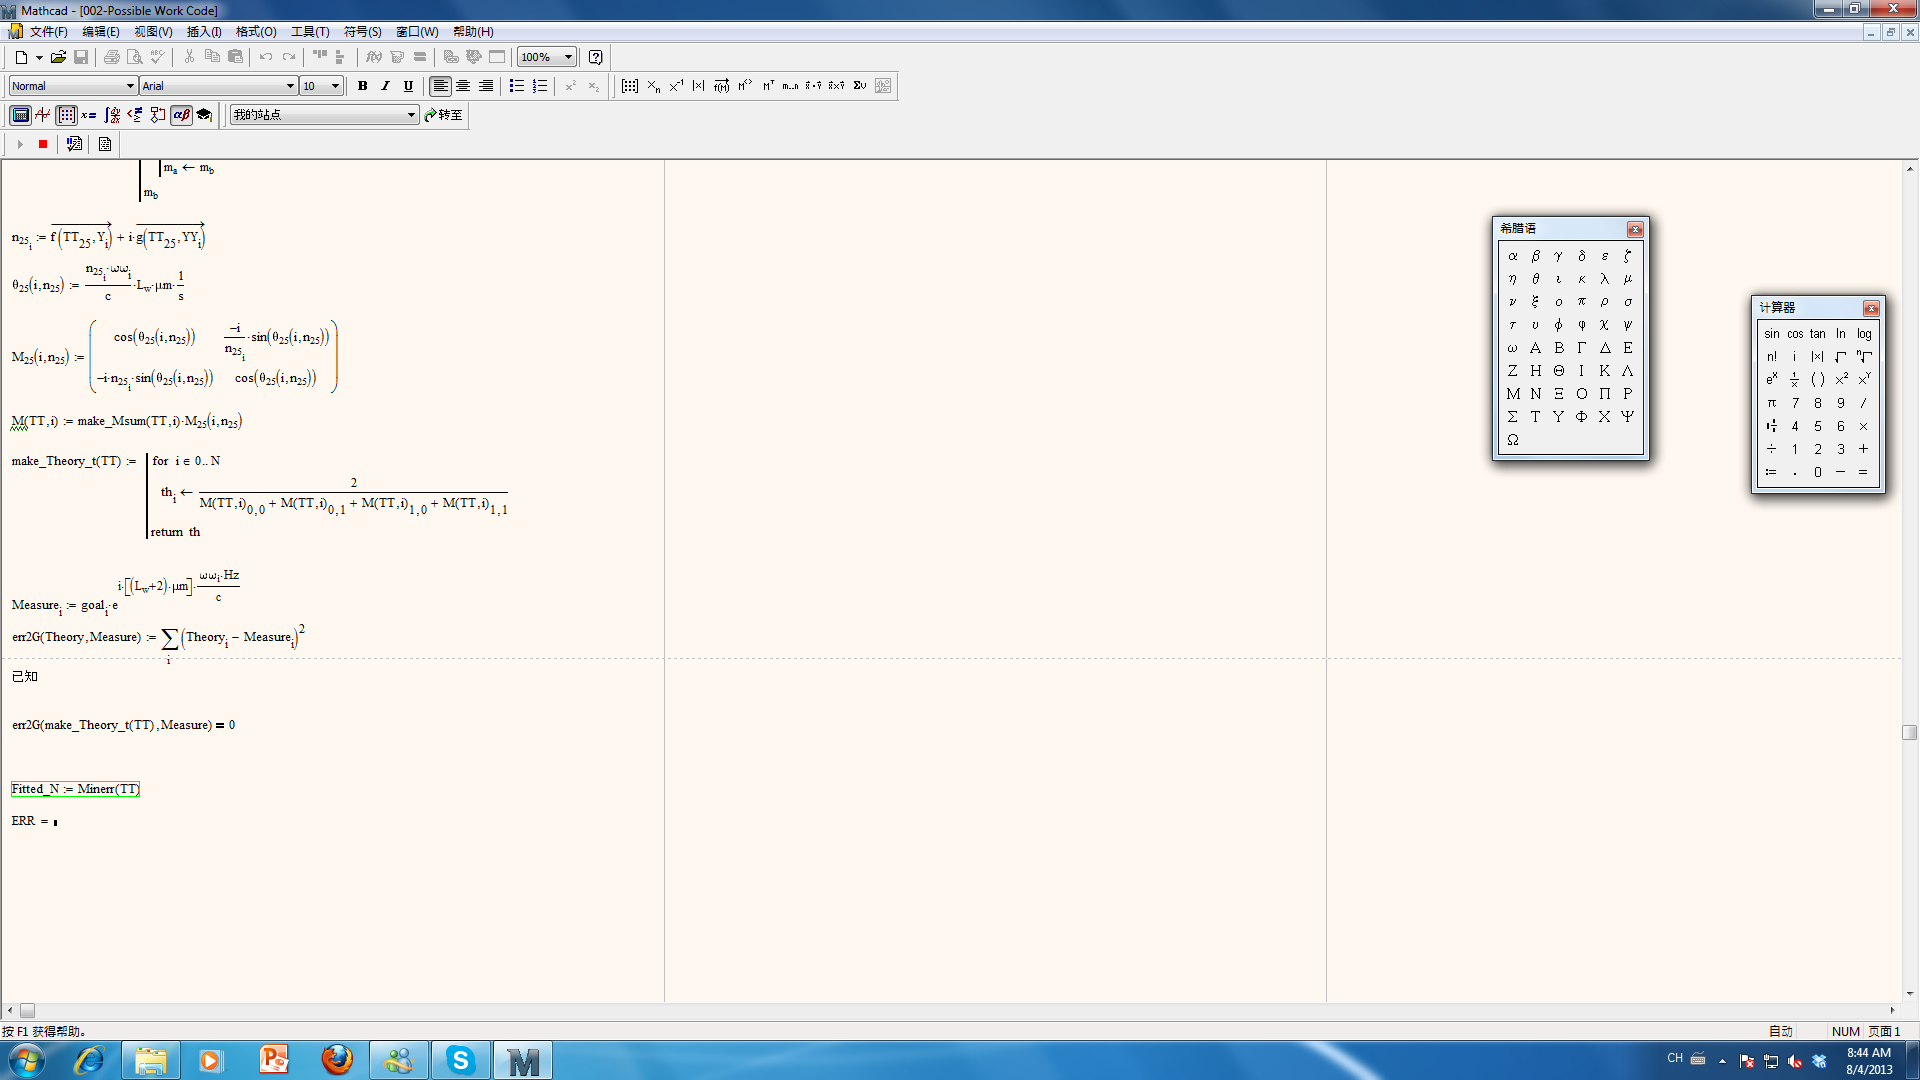
I modify your code and come out the below code (not sure whether you can see it clearly).
For now, M.k() works preoperly (I have successfully tested one element).
However, the problem at meake_Theory_t(TT) is that it took very long time to come out the result.
For i=0,1,2 (just 3 loop), it took over one hour to show the result.
I cannot understand this problem bcz the result came out very fast if I just test one element.
Now I am trying i=0,1,..1500 calculation and see how long will it take.
Due to this problem, Fitted_N=minerr(TT) takes very long time to process(green block, it's running).
Probably I still cannot get the nswer tomorrow. This calculation time is not reasonable.
Another problem is that in the i=0,1,2 (just 3 loop) test, Fitted_N is equal to initial defined stack(TT).
All elements in the vector TT are the same and ERR=0.0611.
I don't expect an exactly the same result because minerr(TT) should find a TT set which has a cloest Theory_t to the Measure_t.
I have tried the manual fitting (change TTs manually to calculate difference btw Theory_t/Measure_t) and found a different TTs with a smaller ERR.
I am not sure whether this code does the fitting to the Measure_t or just inital stack(TT).
Aug 04, 2013
11:35 AM
- Mark as New
- Bookmark
- Subscribe
- Mute
- Subscribe to RSS Feed
- Permalink
- Notify Moderator
Aug 04, 2013
11:35 AM
One thing I can say is that you can at least cut the calculation time down to 25% by changing your make_Theory_t() to the following
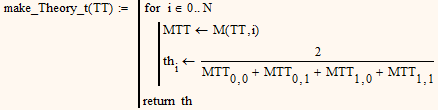
But this will not help that much - calculation time will still be much too high.
BTW, what I had in mind was that make_MSum(TT,i) returns already the sum of all elements of your matrix M (therefore the name) which form the denominator and that all intermediate results like M25 etc woul be calculated IN that routine, not outside - so make_MSum() would be a rther lengthy routine using make_n(). That way the problem of calling the the function four times instead of just once would not have been occured.
Furthemore I fear that minerr(TT) will not work the way you have set it up.
The problem sure is the calculation of M which possibly can be significantly improved (but not without seeing it, of course).
What I can see from your code snippet is that you seem to be confused about variables and functions.
There seems to be no reason making theta25 or M25 a function of n25.
If you did likewise with M(TT,i) this could be a cause for long calculation time, but I'm not sure.
From what you write the calculation of M(TT,10) should take more than 5 minutes, right. Without seeing how the matrices are calculated it can not be said if thats too long, but I guess yes.
Calculated from that the loop from 0 to 1500 should take about three weeks with the version of make_theory_t() you use and still 5 and a half with the slightly improved one here.
One idea: Is there anything in the calculation of M which is independend of i you could precalculate, so you calculate it only once. not 1501 times?

