
Turn on suggestions
Auto-suggest helps you quickly narrow down your search results by suggesting possible matches as you type.
Showing results for
Turn on suggestions
Auto-suggest helps you quickly narrow down your search results by suggesting possible matches as you type.
Showing results for
Community Tip - Stay updated on what is happening on the PTC Community by subscribing to PTC Community Announcements. X
Options
- Subscribe to RSS Feed
- Mark Topic as New
- Mark Topic as Read
- Float this Topic for Current User
- Bookmark
- Subscribe
- Mute
- Printer Friendly Page
How to edit 2D plot?
Feb 28, 2014
03:37 PM
- Mark as New
- Bookmark
- Subscribe
- Mute
- Subscribe to RSS Feed
- Permalink
- Notify Moderator
Feb 28, 2014
03:37 PM
How to edit 2D plot?
Hello,
Im not very new to MathCAD buti was wondering if this would be possible.
Thank you for the support in advance.
Problem...
Below i have the following matrix
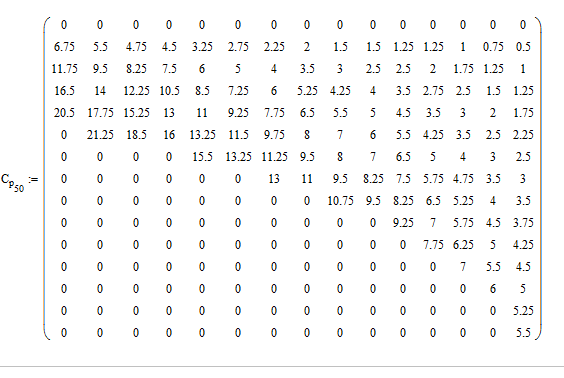
When I plot an "n" column against relative stress values, I get this...
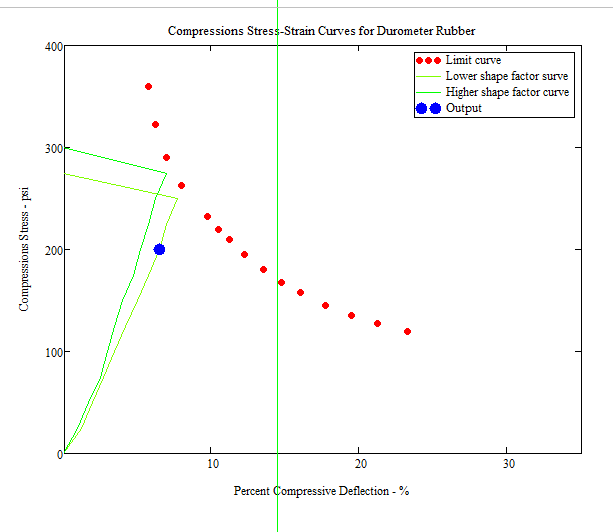
Is it possible to get rid of some values in the plot in order not to get that awful line towards zero?
I know that I could change the plotting to points instead of lines and just change the range to 0.1 to hide those values,
but I would like to see a line if possible
Is there anyway to code it within the graph?
Once again thank you for taking the time to read this and any support.
Labels:
- Labels:
-
Other
1 REPLY 1
Feb 28, 2014
03:45 PM
- Mark as New
- Bookmark
- Subscribe
- Mute
- Subscribe to RSS Feed
- Permalink
- Notify Moderator
Feb 28, 2014
03:45 PM
1) We don't see what you have plotted in the screenshot. Better attach the worksheet rather than showing just pics.
2) What do you mean by "getting rid of some values". What exactly are you trying to do? Maybe it helps replacing the zeros by NaN's.

