
Turn on suggestions
Auto-suggest helps you quickly narrow down your search results by suggesting possible matches as you type.
Showing results for
Turn on suggestions
Auto-suggest helps you quickly narrow down your search results by suggesting possible matches as you type.
Showing results for
Community Tip - You can change your system assigned username to something more personal in your community settings. X
Options
- Subscribe to RSS Feed
- Mark Topic as New
- Mark Topic as Read
- Float this Topic for Current User
- Bookmark
- Subscribe
- Mute
- Printer Friendly Page
Learning functions
Nov 22, 2010
03:08 PM
- Mark as New
- Bookmark
- Subscribe
- Mute
- Subscribe to RSS Feed
- Permalink
- Notify Moderator
Nov 22, 2010
03:08 PM
Learning functions
Hello,
Im new to mathcad and im learning everyday from books and the built in help..
i have to find out a few unknowns from the data provided.. I have plotted the graph in the attachment..I have attached the file in pdf to avoid compatibility issues. Ive also attached it in mathcad 13 format... Ive also attached the data sets from which i took the values from
but i dont understand how to use it or what parameters to give it?
Can you please help me out here.. Am i going right till now?
Thank you
Labels:
- Labels:
-
Statistics_Analysis
16 REPLIES 16
Nov 23, 2010
10:36 AM
- Mark as New
- Bookmark
- Subscribe
- Mute
- Subscribe to RSS Feed
- Permalink
- Notify Moderator
Nov 23, 2010
10:36 AM
Hello UKman,
I'm not certain what you're after but the attached altered MC sheet may help. It is not an elegant solution but it will help to find peaks.
Basically, what I did is as follows:
- use a fitting function to create a polynomial
- extract the coefficients of the fitting function
You need to create a polynomial with this coefficients which than can be evaluated as shown in the quicksheet "Finding roots of a polynomial"
Raiko
Nov 23, 2010
01:35 PM
- Mark as New
- Bookmark
- Subscribe
- Mute
- Subscribe to RSS Feed
- Permalink
- Notify Moderator
Nov 23, 2010
01:35 PM
Thanks a lot for your replt, Raiko.. but the file you attached is not working..
when in open it in Mathcad 14 it gives me an error saying "An unknown runtime error occurred.. Exiting.."
and after his the program crashes.. can you please look into it.. 
Thanks a lot for looking into this problem and for helping out..
can you please provide a working file.. Thank you
Nov 23, 2010
03:23 PM
- Mark as New
- Bookmark
- Subscribe
- Mute
- Subscribe to RSS Feed
- Permalink
- Notify Moderator
Nov 23, 2010
03:23 PM
The peak of what curve Hits or ss?
Mike
Nov 23, 2010
04:51 PM
- Mark as New
- Bookmark
- Subscribe
- Mute
- Subscribe to RSS Feed
- Permalink
- Notify Moderator
Nov 23, 2010
04:51 PM
Hits is the plot of the actual data.. this is just one example of the data sets I have and most are very noisy.. so thats why i used supsmooth..
so I want to predict or find out the peaks of the ss curve..
Thank you for looking at my post
Nov 23, 2010
04:59 PM
- Mark as New
- Bookmark
- Subscribe
- Mute
- Subscribe to RSS Feed
- Permalink
- Notify Moderator
Nov 23, 2010
04:59 PM
Your file seems to be corrupted.
Try re-saving and re-posting.
Mike
Nov 23, 2010
05:03 PM
- Mark as New
- Bookmark
- Subscribe
- Mute
- Subscribe to RSS Feed
- Permalink
- Notify Moderator
Nov 23, 2010
05:03 PM
the file posted by Raiko is corrupt and i requested for a another file.. but the file i attached in the first post.. the mathcad.xmcd is working.. i checked it..
its saved in mathcad 13 version.. can that be a problem? should i save it in mathcad 14?
to avoid these compatibility issues.. i added a pdf printout along with the excel data files..
if the mathcad file doesnt open.. can you please take a look at the pdf I attached.. its a printout of the program.
Thanks a lot.
Nov 23, 2010
05:07 PM
- Mark as New
- Bookmark
- Subscribe
- Mute
- Subscribe to RSS Feed
- Permalink
- Notify Moderator
Nov 23, 2010
05:07 PM
its saved in mathcad 13 version.. can that be a problem? should i save it in mathcad 14?
When possible try and post your worksheets in M11 format for a wider audience.
Mike
Nov 23, 2010
05:09 PM
- Mark as New
- Bookmark
- Subscribe
- Mute
- Subscribe to RSS Feed
- Permalink
- Notify Moderator
Nov 23, 2010
05:09 PM
k. thanks.. ill remeber that next time
im not infront of my laptop now.. so i cant get access to mathcad.. ill post a M11 version tomorrow..
but for now can you please look at the pdf to get a general idea.. its just a 3 line program
Thank you
Nov 23, 2010
05:26 PM
- Mark as New
- Bookmark
- Subscribe
- Mute
- Subscribe to RSS Feed
- Permalink
- Notify Moderator
Nov 23, 2010
05:26 PM
I personally don't need M11, but some forum members do.
I am missing something? If you are trying to extract the two highest values of vector ss will the following do?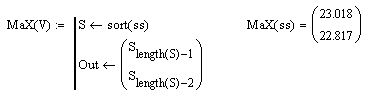
Mike
Nov 24, 2010
05:01 AM
- Mark as New
- Bookmark
- Subscribe
- Mute
- Subscribe to RSS Feed
- Permalink
- Notify Moderator
Nov 24, 2010
05:01 AM
Hi,
sorry for the problems you ran into with that corrupted file.
Anyhow, I've attached a new one with a simpler approach. Just keep in mind that I use a file input for the data which reads directly from the excel file. Unzip the "Voltage" file and right-click on the filoe input icon and choose a new path for data input in the properties dialogue.
Check the MC 13 file whether it helps you
Raiko
Nov 24, 2010
10:05 AM
- Mark as New
- Bookmark
- Subscribe
- Mute
- Subscribe to RSS Feed
- Permalink
- Notify Moderator
Nov 24, 2010
10:05 AM
Don't smooth data that you are going to fit a function to using least squares. Least squares fitting handles noise very well, and smoothing will either have almost no effect or it will bias the parameter estimates. It's better to do the least squares fit using minerr rather than genfit. It's easier to set up and more flexible.
If the heights and/or standard deviations of the two distributions are supposed to be the same you can easily modify the worksheet so that those parameters are scalars rather than two element vectors.
Nov 24, 2010
04:55 PM
- Mark as New
- Bookmark
- Subscribe
- Mute
- Subscribe to RSS Feed
- Permalink
- Notify Moderator
Nov 24, 2010
04:55 PM
Thank you everyone for the all the help..
@Richard Jackson
I have sent you a private message. Can you please check it out.
Thank you
Nov 25, 2010
09:39 AM
- Mark as New
- Bookmark
- Subscribe
- Mute
- Subscribe to RSS Feed
- Permalink
- Notify Moderator
Nov 25, 2010
09:39 AM
I should add that your "noise" does not look at all like noise. Noise looks random, and what you have looks like eack peak is really 3 peaks.
Nov 25, 2010
09:43 AM
- Mark as New
- Bookmark
- Subscribe
- Mute
- Subscribe to RSS Feed
- Permalink
- Notify Moderator
Nov 25, 2010
09:43 AM
This is an example of a good system. I wanted to work on a good system first before i apply this to very noisy signals.
and that is why i wanted to do smoothing to remove the 3 peaks.. which you correctly pointed out to produce wrong results. Thank you
Nov 25, 2010
10:10 AM
- Mark as New
- Bookmark
- Subscribe
- Mute
- Subscribe to RSS Feed
- Permalink
- Notify Moderator
Nov 25, 2010
10:10 AM
Least squares fitting a function to data is only a valid approach if the function models everything in the data other than the random noise. So if you really have 6 peaks you should fit 6 peaks.
If you have very noisy data where you can't even tell there are more than two peaks then you might run into some problelms. I can't say for sure though without seeing an example of the noisy data.
Nov 25, 2010
10:24 AM
- Mark as New
- Bookmark
- Subscribe
- Mute
- Subscribe to RSS Feed
- Permalink
- Notify Moderator
Nov 25, 2010
10:24 AM
I think the most noisy case that I will use will have to be when the two curves overlap slightly.. not have many peaks.. but i dont know yet and will definitly let you know in case of too noisy data giving me problems.

