
Turn on suggestions
Auto-suggest helps you quickly narrow down your search results by suggesting possible matches as you type.
Showing results for
Turn on suggestions
Auto-suggest helps you quickly narrow down your search results by suggesting possible matches as you type.
Showing results for
Community Tip - Your Friends List is a way to easily have access to the community members that you interact with the most! X
Options
- Subscribe to RSS Feed
- Mark Topic as New
- Mark Topic as Read
- Float this Topic for Current User
- Bookmark
- Subscribe
- Mute
- Printer Friendly Page
Making combined plots
Dec 11, 2016
11:41 AM
- Mark as New
- Bookmark
- Subscribe
- Mute
- Subscribe to RSS Feed
- Permalink
- Notify Moderator
Dec 11, 2016
11:41 AM
Making combined plots
A. Marton asks:
If f(x) and f(z) are two functions, is it possible to create such a single plot that would show f(x) on the top and f(z) below?
Two individual plots, of course, can always be arranged by moving them under each other, but it is not the solution that I am looking for. I am a Mathcad 14 user.
Thank you for any advice!
Labels:
- Labels:
-
Other
6 REPLIES 6
Dec 12, 2016
11:39 AM
- Mark as New
- Bookmark
- Subscribe
- Mute
- Subscribe to RSS Feed
- Permalink
- Notify Moderator
Dec 12, 2016
11:39 AM
Show it by hand please!
Dec 12, 2016
11:40 AM
- Mark as New
- Bookmark
- Subscribe
- Mute
- Subscribe to RSS Feed
- Permalink
- Notify Moderator
Dec 12, 2016
11:40 AM
Mathcad 14 (and 15) will allow a second Y axis scale, there's a check box in the properties dialog box. You can then plot both functions on the same graph to different scales. (Prime has not yet learned how to do that.)
So you can plot:
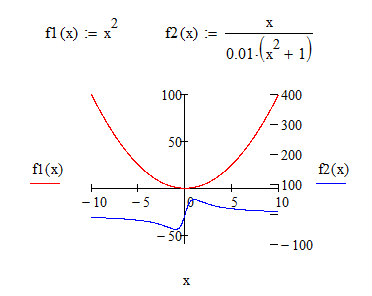
What you wanted?
Dec 12, 2016
01:42 PM
- Mark as New
- Bookmark
- Subscribe
- Mute
- Subscribe to RSS Feed
- Permalink
- Notify Moderator
Dec 12, 2016
01:42 PM
... or so
Dec 12, 2016
02:18 PM
- Mark as New
- Bookmark
- Subscribe
- Mute
- Subscribe to RSS Feed
- Permalink
- Notify Moderator
Dec 12, 2016
02:18 PM
Not sure what exactly you are asking for.
If f(x) and f(z) are two functions
No, its the same function with the name f. It does not matter, that you name the argument differently. Is this really what you mean?
, is it possible to create such a single plot that would show f(x) on the top and f(z) below?
What exactly you mean by "on top of"? Can you give a concrete example?
You know that you can plot more than one function in a Mathcad plot?
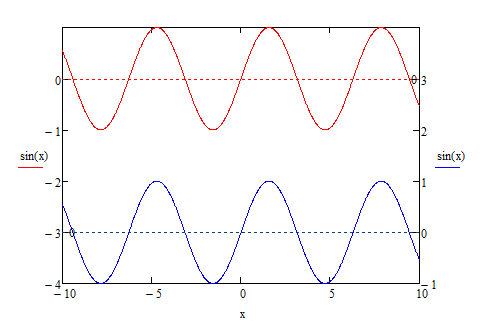
So what could "on top" mean. Show different function for comparison which would overlap if simply plotted in one single plot and so you want them to be separated vertically for better visibility? One way to do this wa sshown by Valeriy Kofanov using the secondary y-axis and different plot ranges on the two y axis.
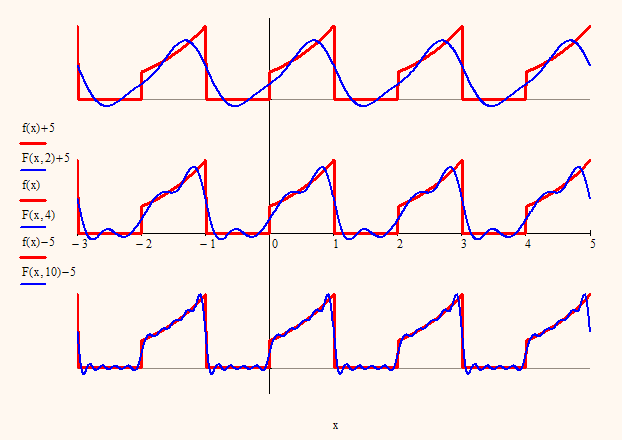
Another way which also works for more than two plots would be to shift the plots by adding or subtracting constant values:
You see the confusion so please clarify the situation.
Dec 13, 2016
03:01 AM
- Mark as New
- Bookmark
- Subscribe
- Mute
- Subscribe to RSS Feed
- Permalink
- Notify Moderator
Dec 13, 2016
03:01 AM
I guess Aurel is looking for the equivalent of Matlab's subplot command. Unfortunately there is nothing like it in MathCad.
The disadvantage of using Mathcad's second y-axis scale is that the two plots might be overlaid on each other, which can be confusing, especially if they are complicated functions. A scale offset requires a mental adjustment even if the two functions have the same units, and an even bigger one if the units are different - also confusing!
The nearest equivalent to a "subplot" command is to physically align the two plots, which, unfortunately, is not the solution being sought!
Alan
Dec 13, 2016
03:09 AM
- Mark as New
- Bookmark
- Subscribe
- Mute
- Subscribe to RSS Feed
- Permalink
- Notify Moderator
Dec 13, 2016
03:09 AM
Thats possible and if the reason why two separate, manually aligned plots are not acceptable is because they are not combined, putting them in a text region might be an option. Maybe Aurel will come back again one day and clarify.

