
Turn on suggestions
Auto-suggest helps you quickly narrow down your search results by suggesting possible matches as you type.
Showing results for
Turn on suggestions
Auto-suggest helps you quickly narrow down your search results by suggesting possible matches as you type.
Showing results for
Options
- Subscribe to RSS Feed
- Mark Topic as New
- Mark Topic as Read
- Float this Topic for Current User
- Bookmark
- Subscribe
- Mute
- Printer Friendly Page
MathCAD Prime plotting scales corrupted
Sep 09, 2016
06:05 PM
- Mark as New
- Bookmark
- Subscribe
- Mute
- Subscribe to RSS Feed
- Permalink
- Notify Moderator
Sep 09, 2016
06:05 PM
MathCAD Prime plotting scales corrupted
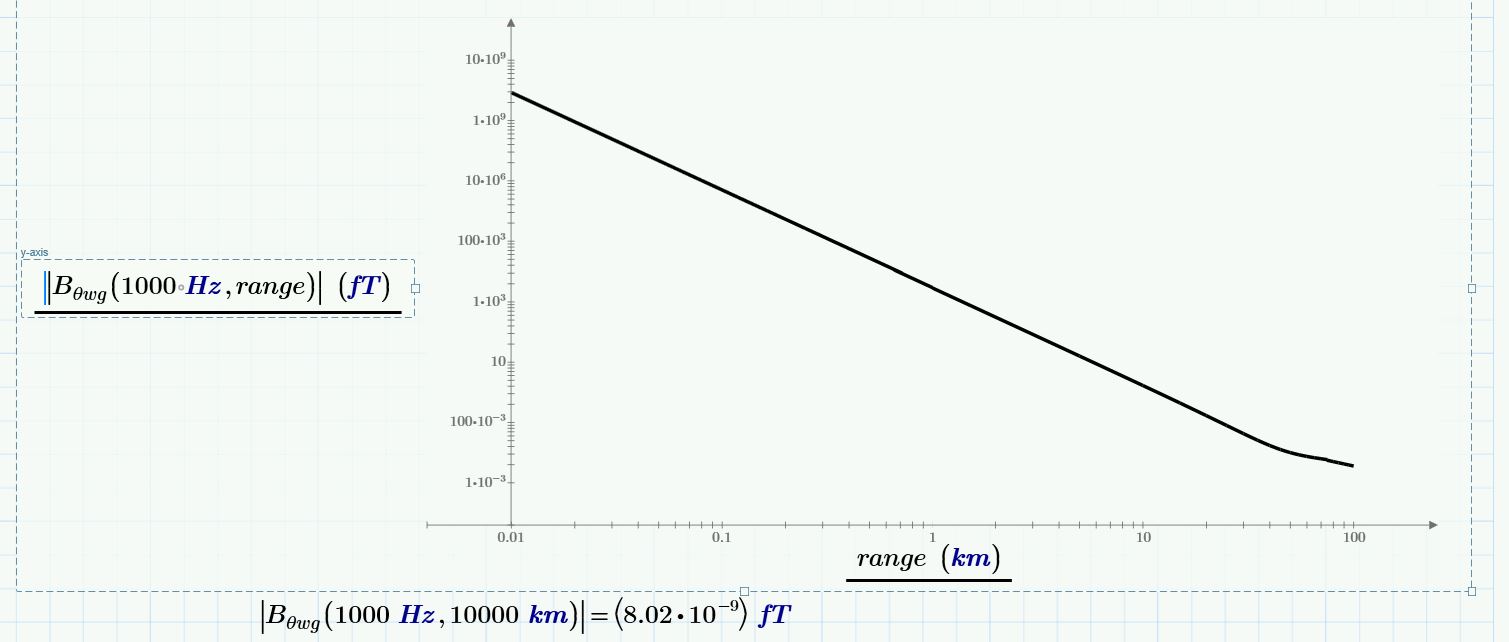
I am trying to plot log-log plots of some equations that produce data in SI units. While the form of the plots appears correct, the Y values are way off. The tick mark values also contain multipliers of 10 in some positions. Here is the plot. I would rather not send the file. A plot should be a plot. The plotted equation evaluated at 100 km is shown. Also, I cannot adjust the size of the unreadable font on the axis values. What goes? I am now transcribing all of my MatCAD work to MathLab because MathCAD as become so poor.
Solved! Go to Solution.
Labels:
- Labels:
-
Statistics_Analysis
- Tags:
- xy plot
1 ACCEPTED SOLUTION
Accepted Solutions
Sep 11, 2016
02:51 PM
- Mark as New
- Bookmark
- Subscribe
- Mute
- Subscribe to RSS Feed
- Permalink
- Notify Moderator
Sep 11, 2016
02:51 PM
Plotting has been a not so strong part of Mathcad always. There's no doubt about that.
You get tick marks with multiples of 10 because you've set Prime to use Engineering display, which uses powers of 10 in multiples of 3 (10^0, 10^3, 10^6 etc.) the intervening decades are then 10*10^0 and 100*10^0 for the first part.
You should be able to change the display format for the plot to Scientific rather than Engineering.
Your values may be way off, because there is a scaling in effect. When plotting on a log scale, you best make sure that whatever you plot is unitless. So divide your values by a constant factor WITH the unit you intend/expect. While that is necessary for log scales to get the plot you expect, it's also wise to do for linear scales.
What's this unit fT ? femto-Tesla?
Success!
Luc
2 REPLIES 2
Sep 11, 2016
02:51 PM
- Mark as New
- Bookmark
- Subscribe
- Mute
- Subscribe to RSS Feed
- Permalink
- Notify Moderator
Sep 11, 2016
02:51 PM
Plotting has been a not so strong part of Mathcad always. There's no doubt about that.
You get tick marks with multiples of 10 because you've set Prime to use Engineering display, which uses powers of 10 in multiples of 3 (10^0, 10^3, 10^6 etc.) the intervening decades are then 10*10^0 and 100*10^0 for the first part.
You should be able to change the display format for the plot to Scientific rather than Engineering.
Your values may be way off, because there is a scaling in effect. When plotting on a log scale, you best make sure that whatever you plot is unitless. So divide your values by a constant factor WITH the unit you intend/expect. While that is necessary for log scales to get the plot you expect, it's also wise to do for linear scales.
What's this unit fT ? femto-Tesla?
Success!
Luc
Sep 11, 2016
06:29 PM
- Mark as New
- Bookmark
- Subscribe
- Mute
- Subscribe to RSS Feed
- Permalink
- Notify Moderator
Sep 11, 2016
06:29 PM
Luc:
Thanks very much. Switching the number format to General helped. Now the results are correct. Also, I did not have to rescale anything and was able to leave the units in fT (which is femto-Tesla). The fonts are still very small, making the results hard to read when pasted into documents. My colleagues scold me for this!
Lionel

