Community Tip - You can Bookmark boards, posts or articles that you'd like to access again easily! X
- Subscribe to RSS Feed
- Mark Topic as New
- Mark Topic as Read
- Float this Topic for Current User
- Bookmark
- Subscribe
- Mute
- Printer Friendly Page
Mathcad 15 3D graph surface contour challenge
- Mark as New
- Bookmark
- Subscribe
- Mute
- Subscribe to RSS Feed
- Permalink
- Notify Moderator
Mathcad 15 3D graph surface contour challenge
I wish to map calculation results in a 2D matrix onto the surface of a hemisphere to produce a "heart map" showing the magnitide (colour) and orientation of the maxima and minima in the dataset. The matrix data are the result of calculation of stresses on a plane for a grid that has been incremented by 15 degrees in the polar and azimuthal directions. I can generate a hemisphere with the appropriate 15 degree grid but do not know how to map my data to this grid. Can it be done? Any assistance would be appreciated.
Cheers
Ross
Solved! Go to Solution.
- Labels:
-
Mathcad Usage
Accepted Solutions
- Mark as New
- Bookmark
- Subscribe
- Mute
- Subscribe to RSS Feed
- Permalink
- Notify Moderator
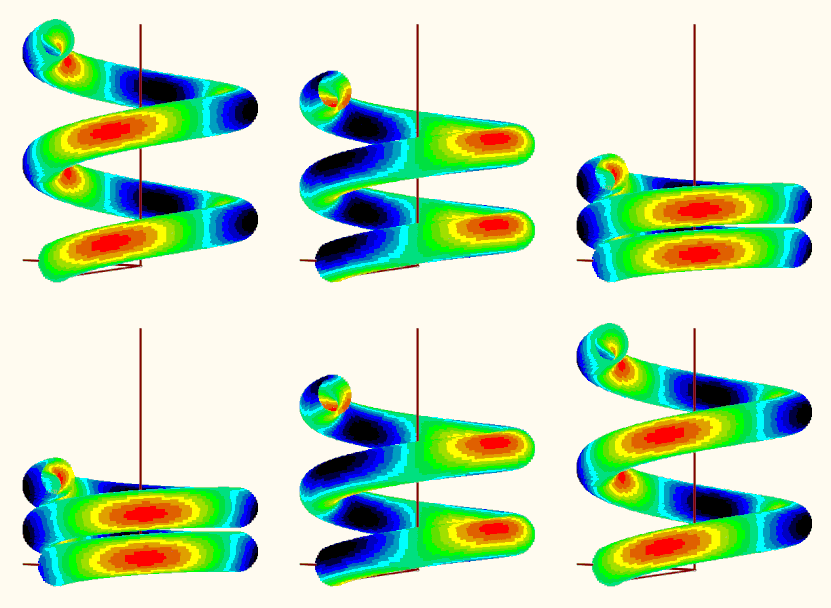
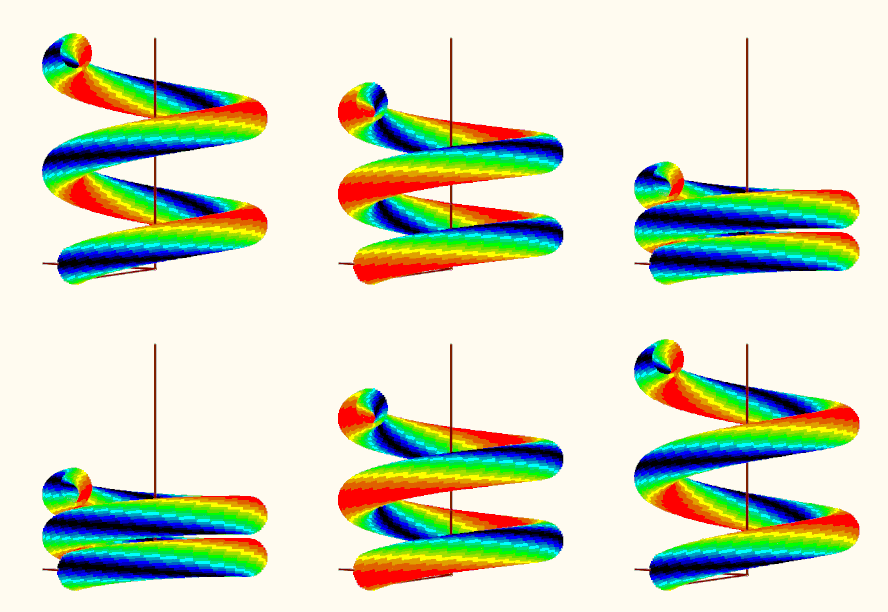
Your question reminded me of an old thread in which a user was also interested in a special coloring of a 3D plot of a helix using a given function. Back then, I 'solved' it in such a way that I realized the coloring by plotting many individual points in the desired colors. A separate plot would have to be set up and formatted for all points of the same color. Quite laborious, which is why I limited myself to just 16 colors. The thread and the files created back then are still available here, if you are interested:
Re: Solid Helix with Surface Color defined by Inde... - PTC Community
I guess using this method could also help creating the 3D sphere you are looking for but it may be quite some work to do.
- Mark as New
- Bookmark
- Subscribe
- Mute
- Subscribe to RSS Feed
- Permalink
- Notify Moderator
I can't think of an easy way to color the sphere according to a stress function.
Her some general thoughts:
Your plots of the stresses (plots of X, Y and Z) lack of correct axis labels. These labels simply are the indices of the matrix and not the azimut and polar angle values.
Here is a way to create these plots with correct axis labels. I also use a functional approach:
In case you'd rather would like to see the axis scaled in degree, you could do it that way:
I now mapped the the angle values to their appropriate xy-values. What you get is not the 3D plot you were asking for but at least its normal projection to the xy-plane.
Mathcads 3D plots (on contrary to its 2D plots) does not accept/ignore Nan's or imaginary values but rather refuses to plot . So I had to replace the values for these points (points outside of the circle) by a number and I had chosen -10 as this seems to be lower than all regular stresses calculated. The value should not be set too low as its considered by the color map of the contour plot and you get less colors for the area inside the circle. You also may play around with the number of contour line (tab "Special" in the 3-D Plot Format menu)
Because min and max stress values differ in the three plots, same color does not mean same stress.
We may add a legend for each plot for a visualization which color corresponds to which stress amount. Its a simple contour plot itself which can be formatted to your needs:
- Mark as New
- Bookmark
- Subscribe
- Mute
- Subscribe to RSS Feed
- Permalink
- Notify Moderator
Your question reminded me of an old thread in which a user was also interested in a special coloring of a 3D plot of a helix using a given function. Back then, I 'solved' it in such a way that I realized the coloring by plotting many individual points in the desired colors. A separate plot would have to be set up and formatted for all points of the same color. Quite laborious, which is why I limited myself to just 16 colors. The thread and the files created back then are still available here, if you are interested:
Re: Solid Helix with Surface Color defined by Inde... - PTC Community
I guess using this method could also help creating the 3D sphere you are looking for but it may be quite some work to do.
- Mark as New
- Bookmark
- Subscribe
- Mute
- Subscribe to RSS Feed
- Permalink
- Notify Moderator
OK, I couldn't resist and adapted the method from the old worksheet to the new task. Since the plot region with the 18 individual plots could be taken over from there (including the colors used there), the work was limited to the "makePoints" function, which calculates a series of points on the sphere with their stress values and then sorts the points into one of 16 matrices depending on the stress value.
So here are your spheres ...
Remark: I notice that the colors are modified (fades/pale, to the worse) when I insert a picture here in the forum. Not sure why. had not noticed that in former times ...
Mathcad 15 worksheet attached
- Mark as New
- Bookmark
- Subscribe
- Mute
- Subscribe to RSS Feed
- Permalink
- Notify Moderator
Werner,
After your fantastic graphics effort I decided to push on to identify the critical plane using a method known as the Maximum Variance Method. If you are happy to assist further, I would appreciate assistance with:
I need to:
- Calculate Var(τq(t) for each angle
- Create a matrix with columns [θ ϕ α Var(τq(t)]
- Search and locate Max Var(τq(t)
- Report Max Var(τq(t)
- Plot Var(τq(t) on sphere using Makepoints to visualise the location of max shear stress
I can calculate Var(τq(t) but i am having trouble assembling the [θ ϕ α Var(τq(t)] data into a matrix form that can be used with your MakePoints plot routine to show the maximun location.
I would appreciate assistance if you have the time.
Regards,
Ross
- Mark as New
- Bookmark
- Subscribe
- Mute
- Subscribe to RSS Feed
- Permalink
- Notify Moderator
Your Excel file with the data is missing
- Mark as New
- Bookmark
- Subscribe
- Mute
- Subscribe to RSS Feed
- Permalink
- Notify Moderator
Werner,
Thats what we call a "seniors moment"!
File attached with thanks
Ross
- Mark as New
- Bookmark
- Subscribe
- Mute
- Subscribe to RSS Feed
- Permalink
- Notify Moderator
Werner,
I hope you have not been offended by my comment regarding a "seniors moment".
It was a comment directed at myself (its a common saying in Australia) for being forgetful in my old age at not including the excel file and certainly not intended to be disrespectful or make any reference to yourself. My apologies if this is how it was received.
Regards,
Ross


