
Turn on suggestions
Auto-suggest helps you quickly narrow down your search results by suggesting possible matches as you type.
Showing results for
Turn on suggestions
Auto-suggest helps you quickly narrow down your search results by suggesting possible matches as you type.
Showing results for
Community Tip - New to the community? Learn how to post a question and get help from PTC and industry experts! X
Options
- Subscribe to RSS Feed
- Mark Topic as New
- Mark Topic as Read
- Float this Topic for Current User
- Bookmark
- Subscribe
- Mute
- Printer Friendly Page
PDF-->CDF
Apr 25, 2014
10:54 AM
- Mark as New
- Bookmark
- Subscribe
- Mute
- Subscribe to RSS Feed
- Permalink
- Notify Moderator
Apr 25, 2014
10:54 AM
PDF-->CDF
Hi, All --
So I have a PDF represented by discrete data points. I have splined this and integrated it, so I should get the CDF, right? Instead, the results look a little funky. What am I missing?
Matt
Solved! Go to Solution.
Labels:
- Labels:
-
Statistics_Analysis
1 ACCEPTED SOLUTION
Accepted Solutions
Apr 25, 2014
10:59 AM
- Mark as New
- Bookmark
- Subscribe
- Mute
- Subscribe to RSS Feed
- Permalink
- Notify Moderator
Apr 25, 2014
10:59 AM
Instead, the results look a little funky.
Why? What result did you expect? It looks OK to me. If you expected a slower approach to 1 - look at the graph without the log scale at the abscissa.
4 REPLIES 4
Apr 25, 2014
10:59 AM
- Mark as New
- Bookmark
- Subscribe
- Mute
- Subscribe to RSS Feed
- Permalink
- Notify Moderator
Apr 25, 2014
10:59 AM
Instead, the results look a little funky.
Why? What result did you expect? It looks OK to me. If you expected a slower approach to 1 - look at the graph without the log scale at the abscissa.
Apr 25, 2014
11:02 AM
- Mark as New
- Bookmark
- Subscribe
- Mute
- Subscribe to RSS Feed
- Permalink
- Notify Moderator
Apr 25, 2014
11:02 AM
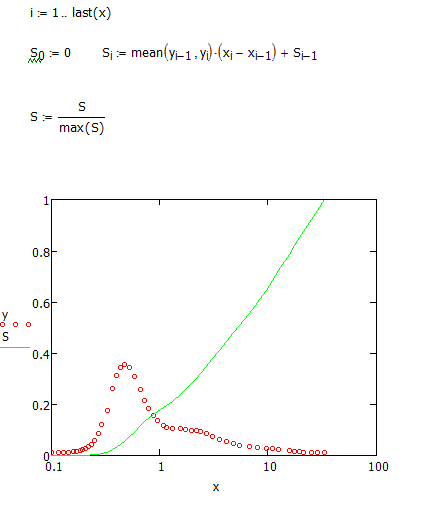
If I look at, say x = 1, it looks like I should have more than ~20% of the area under the PDF accumulated, but maybe it's just the log scale playing tricks on my intuition?
Apr 25, 2014
11:27 AM
- Mark as New
- Bookmark
- Subscribe
- Mute
- Subscribe to RSS Feed
- Permalink
- Notify Moderator
Apr 25, 2014
11:27 AM
but maybe it's just the log scale playing tricks on my intuition?
I think that is it - turn off log scale just for a moment and have a look. Lower values of x are very largely stretched by the log scale and this gives the impression of a bigger area under the curve than it is. You have a high, but only very narrow spike at x=0.5. Without log scale it looks more reasonable that we have 50% around x=5.3 - it looks impossible with log scale, though.
Apr 25, 2014
11:34 AM
- Mark as New
- Bookmark
- Subscribe
- Mute
- Subscribe to RSS Feed
- Permalink
- Notify Moderator
Apr 25, 2014
11:34 AM
Moe Szyslak wrote:
...but maybe it's just the log scale playing tricks on my intuition?
I think so too. You get much the same curve by doing a simpler calculation of the area using the mean value of adjacent points:
Alan

