
Turn on suggestions
Auto-suggest helps you quickly narrow down your search results by suggesting possible matches as you type.
Showing results for
Turn on suggestions
Auto-suggest helps you quickly narrow down your search results by suggesting possible matches as you type.
Showing results for
Community Tip - Want the oppurtunity to discuss enhancements to PTC products? Join a working group! X
Options
- Subscribe to RSS Feed
- Mark Topic as New
- Mark Topic as Read
- Float this Topic for Current User
- Bookmark
- Subscribe
- Mute
- Printer Friendly Page
Plot shear force and moments in Mathcad
Nov 16, 2015
10:59 PM
- Mark as New
- Bookmark
- Subscribe
- Mute
- Subscribe to RSS Feed
- Permalink
- Notify Moderator
Nov 16, 2015
10:59 PM
Plot shear force and moments in Mathcad
Hello all,
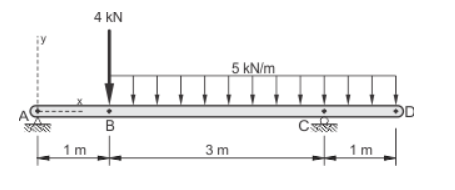
We are learning shear force and moments and we are drawing them by hand. I understand all the calculations and how to draw shear force and bending moment diagrams but the bonus question on our assignment is to plot the diagram below in Mathcad using x-y graphs. If someone could help me with it I would really appreciate it. We Wont be taught how to do it in Mathcad but i am sure it would be useful to know.
Solved! Go to Solution.
Labels:
- Labels:
-
Algebra_Geometry
44 REPLIES 44
Nov 18, 2015
11:07 AM
- Mark as New
- Bookmark
- Subscribe
- Mute
- Subscribe to RSS Feed
- Permalink
- Notify Moderator
Nov 18, 2015
11:07 AM
Matt - you're so close! You'll need to use the AND operator (upside-down "V") instead of the OR operator (right-side-up "V"):
V(x) = | ...
| VBC(x) if x>1 AND x<4
| ...
Alternatively, Mathcad will allow you to write it as:
V(x) = | ...
| VBC(x) if 1<x<4
| ...
Next try to graph it. Note that Mathcad graphs don't handle units, so you need to divide each axis input by the unit you want graphed.
Nov 18, 2015
10:59 AM
- Mark as New
- Bookmark
- Subscribe
- Mute
- Subscribe to RSS Feed
- Permalink
- Notify Moderator
Nov 18, 2015
10:59 AM
I sort of have it working. I'm obviously missing something. How do I get the numbers to show correctly on the left side? How do I get -11 to connect with 5 and is it possible to
have a line through zero?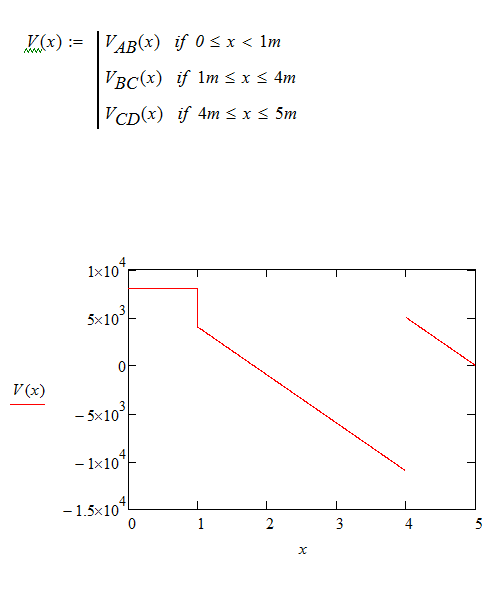
Nov 18, 2015
11:12 AM
- Mark as New
- Bookmark
- Subscribe
- Mute
- Subscribe to RSS Feed
- Permalink
- Notify Moderator
Nov 18, 2015
11:12 AM
You beat me on the reply. I see you already corrected V(x) and have a plot.
Mathcad is plotting in its default units: Newtons & meters. You're lucky that you want meters, so the x-axis looks good. However, I would recommend dividing each axis input by its intended unit. This helps to annotate your graph, too.
Play with some of the plot features: right-click, Format. You can display gridlines if you want. I don't know if you can only display zero, though. If you need it, we can add a plot of zero.
Nov 18, 2015
11:19 AM
- Mark as New
- Bookmark
- Subscribe
- Mute
- Subscribe to RSS Feed
- Permalink
- Notify Moderator
Nov 18, 2015
11:19 AM
Mark Gase wrote:
You're lucky that you want meters, so the x-axis looks good. However, I would recommend dividing each axis input by its intended unit. This helps to annotate your graph, too.
I don't know what you mean when you said "I would recommend dividing each axis input by its intended unit."
Nov 18, 2015
11:21 AM
- Mark as New
- Bookmark
- Subscribe
- Mute
- Subscribe to RSS Feed
- Permalink
- Notify Moderator
Nov 18, 2015
11:21 AM
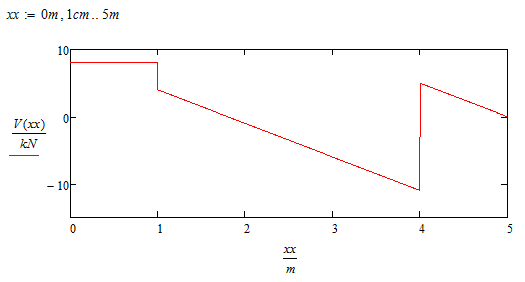
see the graph I just posted below.
The y-axis input is: V(xx)/kN
The x-axis input is: xx/m
Nov 18, 2015
11:16 AM
- Mark as New
- Bookmark
- Subscribe
- Mute
- Subscribe to RSS Feed
- Permalink
- Notify Moderator
Nov 18, 2015
11:16 AM
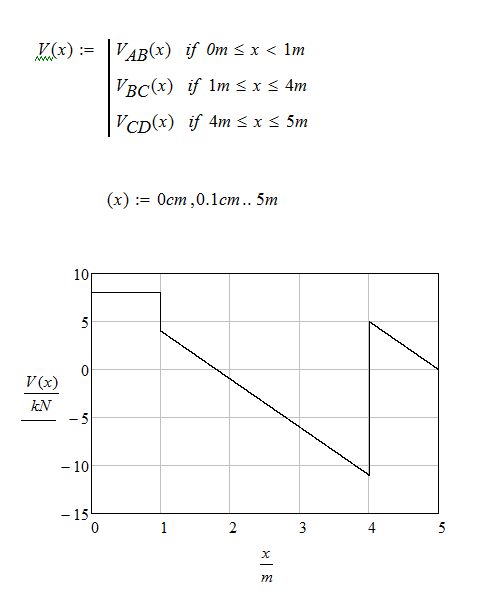
I'm not sure why you get the discontinuity at 4. It's something to do with what Mathcad is doing in the background. Perhaps someone else can provide clarification.
This solves the issue:
Nov 18, 2015
11:21 AM
- Mark as New
- Bookmark
- Subscribe
- Mute
- Subscribe to RSS Feed
- Permalink
- Notify Moderator
Nov 18, 2015
11:21 AM
It worked for me also. I have seen a few people do that on there work.
Nov 18, 2015
11:22 AM
- Mark as New
- Bookmark
- Subscribe
- Mute
- Subscribe to RSS Feed
- Permalink
- Notify Moderator
Nov 18, 2015
11:22 AM
Are you now satisfied with your shear plot, or did you have further questions?
Should we move on the to moments?
Nov 18, 2015
11:29 AM
- Mark as New
- Bookmark
- Subscribe
- Mute
- Subscribe to RSS Feed
- Permalink
- Notify Moderator
Nov 18, 2015
11:29 AM
I think it looks good. Lets move on to moments. Whats next?
Nov 18, 2015
11:55 AM
- Mark as New
- Bookmark
- Subscribe
- Mute
- Subscribe to RSS Feed
- Permalink
- Notify Moderator
Nov 18, 2015
11:55 AM
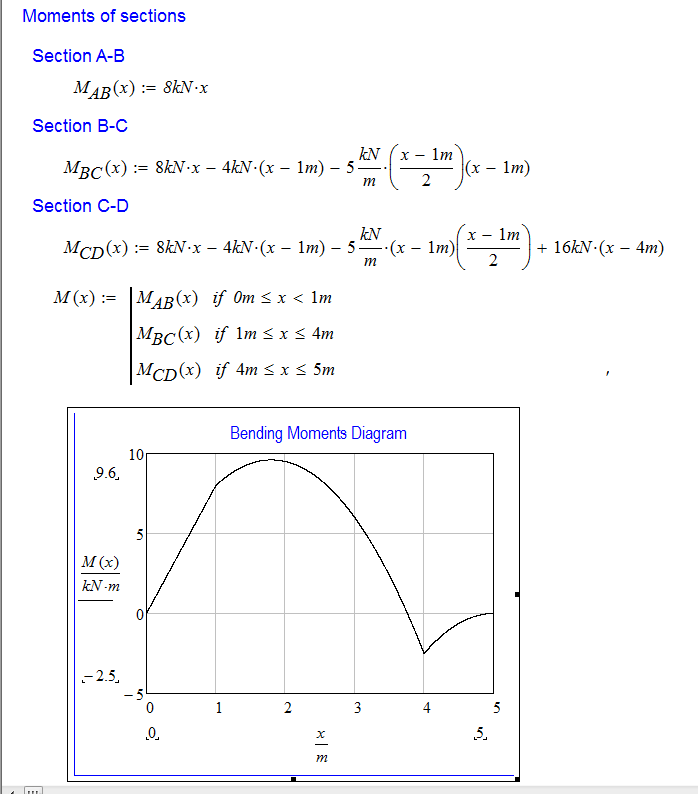
Next you need to define your moment equation(s). You can do this two ways:
1.) you can define your three segmented equations and combine them like you did for shear.
2.) if you understand the relationship between shear and moment, you can make Mathcad do the work for you.
Your choice. I think you already have the skills to tackle option 1 on your own. If you want to go with option 2, you need to identify the relationship between the shear plot and the moment plot.
Nov 18, 2015
12:08 PM
- Mark as New
- Bookmark
- Subscribe
- Mute
- Subscribe to RSS Feed
- Permalink
- Notify Moderator
Nov 18, 2015
12:08 PM
I will go with option 1. Should I make new equations with moments around each section and combine them the same way?
Nov 18, 2015
12:16 PM
- Mark as New
- Bookmark
- Subscribe
- Mute
- Subscribe to RSS Feed
- Permalink
- Notify Moderator
Nov 18, 2015
12:16 PM
Yes - just like with the shear equations.
Nov 18, 2015
01:54 PM
- Mark as New
- Bookmark
- Subscribe
- Mute
- Subscribe to RSS Feed
- Permalink
- Notify Moderator
Nov 18, 2015
01:54 PM
Did I nail it? When I click on the table I can see max 9.6 and min -2.5, is there a way to make them stay on the table when it is deselected?
Nov 18, 2015
02:30 PM
- Mark as New
- Bookmark
- Subscribe
- Mute
- Subscribe to RSS Feed
- Permalink
- Notify Moderator
Nov 18, 2015
02:30 PM
Congratulations - looks good!
You cannot get the the max & min values to show on the graph like that (at least as far as I know), but here is a way to calculate the maximum value:
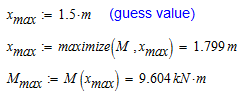
Similar calculations can be used to determine the minimum.
Nov 18, 2015
02:52 PM
- Mark as New
- Bookmark
- Subscribe
- Mute
- Subscribe to RSS Feed
- Permalink
- Notify Moderator
Nov 18, 2015
02:52 PM
Now that you have solved the problem, attached is my take on it. Certainly not the only way.
A few things to note:
1.) Instead of defining functions with numerical values (either given or calculated), I assign a variable to each piece of information and then use the variable in the function definitions. This is crucial in “real-world” use of Mathcad for adjustability & reusability. Image you’re working on a project where the initial design is as shown in your problem, but then the 1m cantilever is later changed to 1.5m. In your document, you’ll need to go through and make the adjustment in each equation. In my document, you just change one variable.
2.) I used “option 2” to define M(x). See if it makes sense to you. As an added bonus, I showed (on sheets 4-5) how to back-calculate the moment equations for each segment.
3.) Add descriptive text. I was lazy and did not do this in the attached document. However, text is very important to give the reader an explanation of what the equations show.
- « Previous
-
- 1
- 2
- Next »

