Turn on suggestions
Auto-suggest helps you quickly narrow down your search results by suggesting possible matches as you type.
Showing results for
Turn on suggestions
Auto-suggest helps you quickly narrow down your search results by suggesting possible matches as you type.
Showing results for
Community Tip - Visit the PTCooler (the community lounge) to get to know your fellow community members and check out some of Dale's Friday Humor posts! X
Options
- Subscribe to RSS Feed
- Mark Topic as New
- Mark Topic as Read
- Float this Topic for Current User
- Bookmark
- Subscribe
- Mute
- Printer Friendly Page
Plotting x,y,z,p data
Mar 01, 2012
09:19 AM
- Mark as New
- Bookmark
- Subscribe
- Mute
- Subscribe to RSS Feed
- Permalink
- Notify Moderator
Mar 01, 2012
09:19 AM
Plotting x,y,z,p data
To all
I have an input csv file of x,y,z,p data. Where x,y,z are the coordinates of nodes and p is a number (pressure)
I can create a scatter plot of the the x,y,z, see atttached, but cannot create a plot of the value p (as a function of the nodes position). Is there a way of doing this?
Thanks
JXB
Labels:
- Labels:
-
Statistics_Analysis
2 REPLIES 2
Mar 01, 2012
12:04 PM
- Mark as New
- Bookmark
- Subscribe
- Mute
- Subscribe to RSS Feed
- Permalink
- Notify Moderator
Mar 01, 2012
12:04 PM
You want a 4D plot? That's not possible. In theory you could have an xyz surface, with colors on it that represent p, but Mathcad can't do it (it's been asked for, but we don't have it).
Mar 01, 2012
01:34 PM
- Mark as New
- Bookmark
- Subscribe
- Mute
- Subscribe to RSS Feed
- Permalink
- Notify Moderator
Mar 01, 2012
01:34 PM
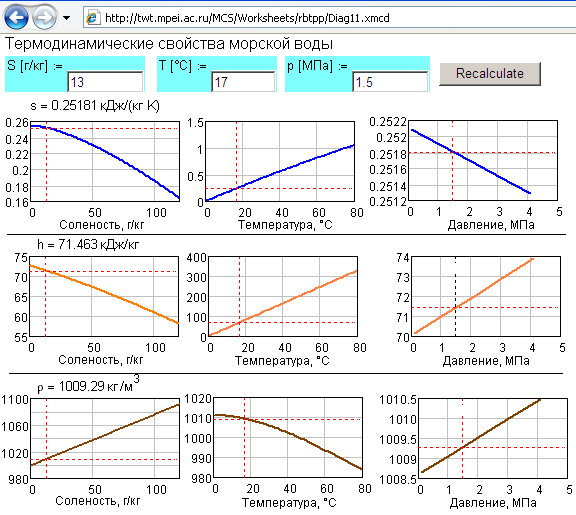
Properties of sea water...
It is a function of 3 arguments...
I use not a surface plot but a set ot 2D plot.
See for example