Community Tip - Your Friends List is a way to easily have access to the community members that you interact with the most! X
- Subscribe to RSS Feed
- Mark Topic as New
- Mark Topic as Read
- Float this Topic for Current User
- Bookmark
- Subscribe
- Mute
- Printer Friendly Page
Problem with Graphs in Mathcad 15
- Mark as New
- Bookmark
- Subscribe
- Mute
- Subscribe to RSS Feed
- Permalink
- Notify Moderator
Problem with Graphs in Mathcad 15
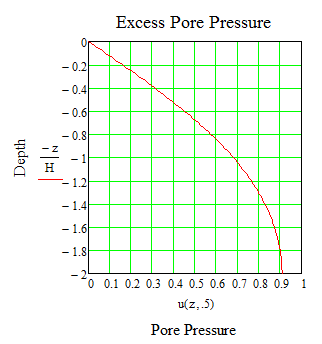
I recently opened a couple of worksheets in Mathcad 15 that I hadn't used in 4-5 years. They were created in an earlier version. The graph scales in these worksheets contain one or more numbers with a large number of decimals; for instance 0.299999999999 instead of 0.3. The number of these that appear in any particular axis (always the vertical) varies with the number of increments I assign to that axis. I've tried to change the number of digits after the decimal point [Format:Number Format] but nothing changes.
Does anyone know of a fix for this?
Solved! Go to Solution.
- Labels:
-
Other
Accepted Solutions
- Mark as New
- Bookmark
- Subscribe
- Mute
- Subscribe to RSS Feed
- Permalink
- Notify Moderator
It's a bug. If you make the y-axis go 0-2, instead of 2-0, no problem. If you switch the axes, then the same problem ocurrs on the x-axis. Right now, I can't see any way to fix it.
- Mark as New
- Bookmark
- Subscribe
- Mute
- Subscribe to RSS Feed
- Permalink
- Notify Moderator
Could you post an example worksheet.
- Mark as New
- Bookmark
- Subscribe
- Mute
- Subscribe to RSS Feed
- Permalink
- Notify Moderator
I'm afraid I can't figure out how to do that. Is there a way to attache the file? Or do I have to create an image of the worksheet?
- Mark as New
- Bookmark
- Subscribe
- Mute
- Subscribe to RSS Feed
- Permalink
- Notify Moderator
You can attach a file by selecting 'Use advanced editor' in the top right corner of the reply box.
Mike
- Mark as New
- Bookmark
- Subscribe
- Mute
- Subscribe to RSS Feed
- Permalink
- Notify Moderator
- Mark as New
- Bookmark
- Subscribe
- Mute
- Subscribe to RSS Feed
- Permalink
- Notify Moderator
It's a bug. If you make the y-axis go 0-2, instead of 2-0, no problem. If you switch the axes, then the same problem ocurrs on the x-axis. Right now, I can't see any way to fix it.
- Mark as New
- Bookmark
- Subscribe
- Mute
- Subscribe to RSS Feed
- Permalink
- Notify Moderator
Yup, a bug, an upside down bug.
But, if you see the world as a structural engineer, and not a geotechnical engineer, all is good.

- Mark as New
- Bookmark
- Subscribe
- Mute
- Subscribe to RSS Feed
- Permalink
- Notify Moderator
Yup, a bug, an upside down bug.
Unless it's on the x-axis, in which case it's a backwards bug ![]()
- Mark as New
- Bookmark
- Subscribe
- Mute
- Subscribe to RSS Feed
- Permalink
- Notify Moderator
Some possible workarounds are in the attached.
Alan


