
Turn on suggestions
Auto-suggest helps you quickly narrow down your search results by suggesting possible matches as you type.
Showing results for
Turn on suggestions
Auto-suggest helps you quickly narrow down your search results by suggesting possible matches as you type.
Showing results for
Community Tip - You can subscribe to a forum, label or individual post and receive email notifications when someone posts a new topic or reply. Learn more! X
Options
- Subscribe to RSS Feed
- Mark Topic as New
- Mark Topic as Read
- Float this Topic for Current User
- Bookmark
- Subscribe
- Mute
- Printer Friendly Page
Simple function plot peculiarity
Aug 01, 2014
03:12 PM
- Mark as New
- Bookmark
- Subscribe
- Mute
- Subscribe to RSS Feed
- Permalink
- Notify Moderator
Aug 01, 2014
03:12 PM
Simple function plot peculiarity
Hi guys, can someone please explain to me why the attached plots are completely wrong in MP3, whereas they are fine in M15 (where the original worksheet was built)? Obviously the MP3 plots are correct for the high Reynolds numbers, but what happens with the low Rn values? Do I need to tabulate the independent variable? Kind of beginner's question -sorry about that.
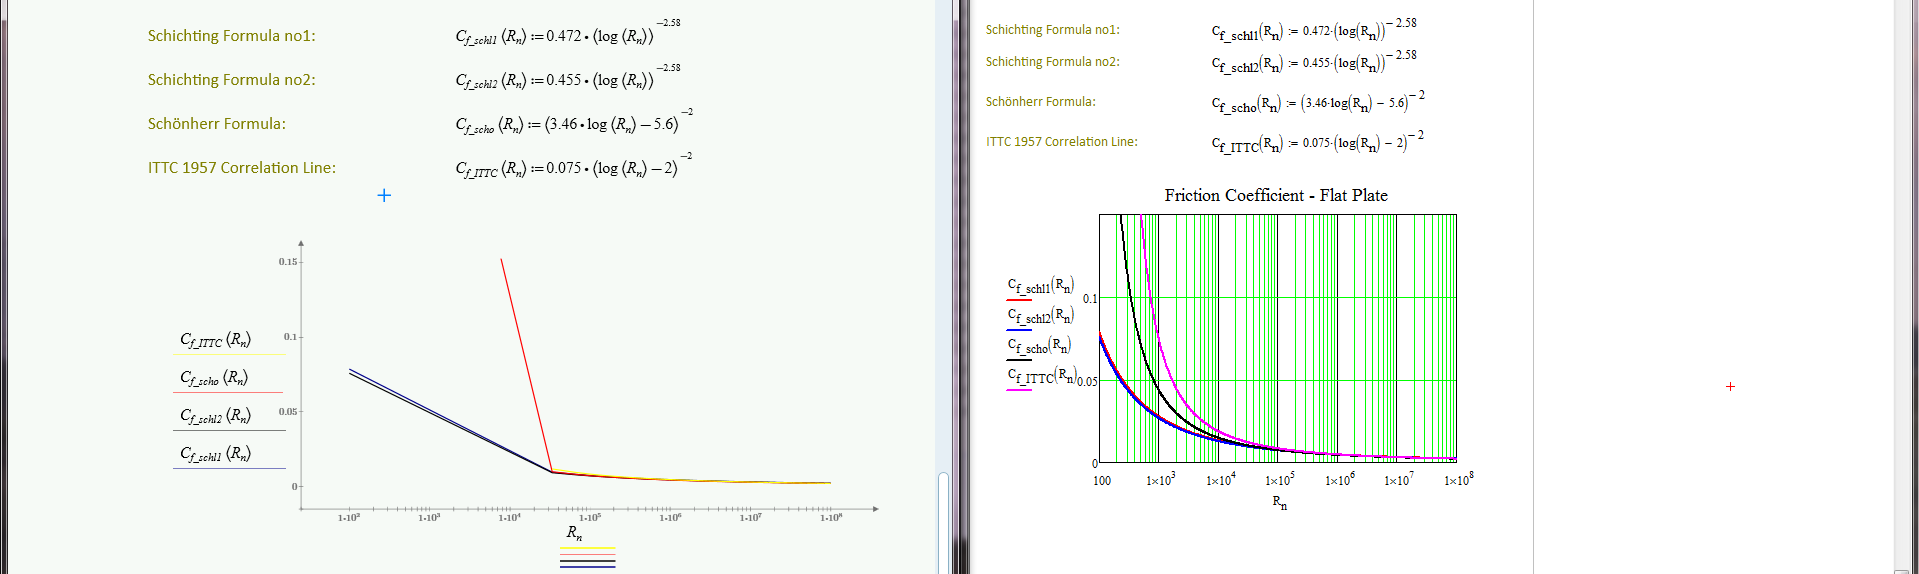
Thanks 🙂
PR
2 REPLIES 2
Aug 01, 2014
03:46 PM
- Mark as New
- Bookmark
- Subscribe
- Mute
- Subscribe to RSS Feed
- Permalink
- Notify Moderator
Aug 01, 2014
03:46 PM
You should have attached the worksheets. Without its hard to tell.
You may try to increase the number of points on the plot format ribbon.
Otherwise you may try a vectorized approach with the help of logspace() or logpts().
BTW, is there any specific reason for the step back from Mathcad 15 to Prime?
Aug 01, 2014
04:45 PM
- Mark as New
- Bookmark
- Subscribe
- Mute
- Subscribe to RSS Feed
- Permalink
- Notify Moderator
Aug 01, 2014
04:45 PM
Is Rn defined as a vector, or are you just relying on the quickplot feature?

