Turn on suggestions
Auto-suggest helps you quickly narrow down your search results by suggesting possible matches as you type.
Showing results for
Turn on suggestions
Auto-suggest helps you quickly narrow down your search results by suggesting possible matches as you type.
Showing results for
Community Tip - Learn all about PTC Community Badges. Engage with PTC and see how many you can earn! X
Options
- Subscribe to RSS Feed
- Mark Topic as New
- Mark Topic as Read
- Float this Topic for Current User
- Bookmark
- Subscribe
- Mute
- Printer Friendly Page
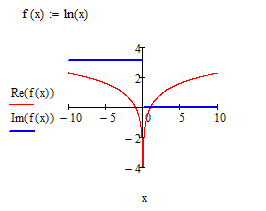
Why is ln(x) not plotted below about -5?
Feb 13, 2015
09:04 PM
- Mark as New
- Bookmark
- Subscribe
- Mute
- Subscribe to RSS Feed
- Permalink
- Notify Moderator
Feb 13, 2015
09:04 PM
Why is ln(x) not plotted below about -5?
Asking for calculated values returns accurate results, but the plot cuts off below approximately -4.6 with any zoom.
4 REPLIES 4
Feb 13, 2015
09:35 PM
- Mark as New
- Bookmark
- Subscribe
- Mute
- Subscribe to RSS Feed
- Permalink
- Notify Moderator
Feb 13, 2015
09:35 PM
Please post a worksheet. There is no way to answer your question without a worksheet showing what you have done. You should not be able to plot ln(x) for any number less than or equal to zero. ln(0) is undefined, and ln(<0) is a complex number.
Feb 13, 2015
09:52 PM
- Mark as New
- Bookmark
- Subscribe
- Mute
- Subscribe to RSS Feed
- Permalink
- Notify Moderator
Feb 14, 2015
08:06 AM
- Mark as New
- Bookmark
- Subscribe
- Mute
- Subscribe to RSS Feed
- Permalink
- Notify Moderator
Feb 14, 2015
08:06 AM
OK. Now I see what you mean. It's because you are using the Quickplot feature of Mathcad. It chooses the number of points to plot, and the location of those points. If you define x using a range variable you have more control.
Feb 13, 2015
10:53 PM
- Mark as New
- Bookmark
- Subscribe
- Mute
- Subscribe to RSS Feed
- Permalink
- Notify Moderator
Feb 13, 2015
10:53 PM