
Turn on suggestions
Auto-suggest helps you quickly narrow down your search results by suggesting possible matches as you type.
Showing results for
Turn on suggestions
Auto-suggest helps you quickly narrow down your search results by suggesting possible matches as you type.
Showing results for
Community Tip - Stay updated on what is happening on the PTC Community by subscribing to PTC Community Announcements. X
Options
- Subscribe to RSS Feed
- Mark Topic as New
- Mark Topic as Read
- Float this Topic for Current User
- Bookmark
- Subscribe
- Mute
- Printer Friendly Page
X-Y Trace precision
Mar 15, 2015
12:45 PM
- Mark as New
- Bookmark
- Subscribe
- Mute
- Subscribe to RSS Feed
- Permalink
- Notify Moderator
Mar 15, 2015
12:45 PM
X-Y Trace precision
I have a question about the x-y trace function in MC15
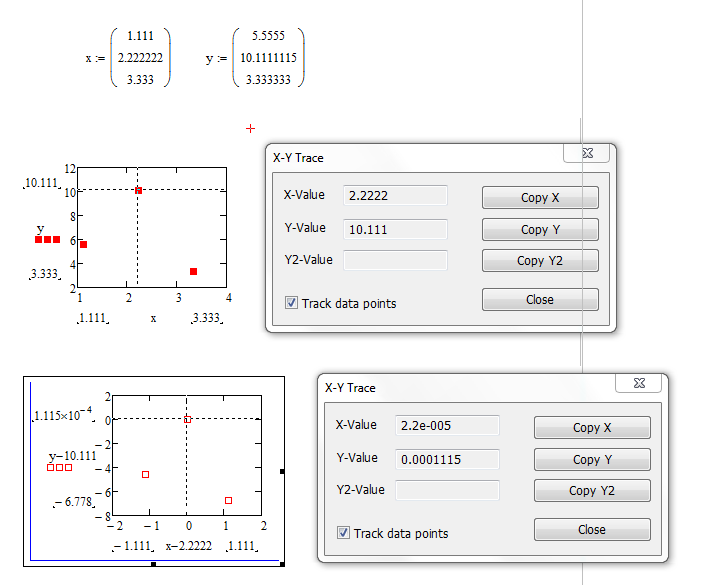
When you select a point, the trace box only displays the co-ords to 5 sig figs - if you "Copy x" or "copy Y" you don't get any more precision, and it is not enough to uniquely identify a point when you have a Monte Carlo analysis with 10^6 points. Is there any way I can increase the resolution? The little example below illustrates my point

Labels:
- Labels:
-
Statistics_Analysis
7 REPLIES 7
Mar 15, 2015
05:26 PM
- Mark as New
- Bookmark
- Subscribe
- Mute
- Subscribe to RSS Feed
- Permalink
- Notify Moderator
Mar 15, 2015
05:26 PM
Unfortunately, 5 significant figures is what you get.
Mar 16, 2015
08:58 AM
- Mark as New
- Bookmark
- Subscribe
- Mute
- Subscribe to RSS Feed
- Permalink
- Notify Moderator
Mar 16, 2015
08:58 AM
You could try something like subtracting the displayed trace values from everything and plotting the result. The new trace should show the next 5 significant figures.:
Alan.
Mar 16, 2015
10:22 AM
- Mark as New
- Bookmark
- Subscribe
- Mute
- Subscribe to RSS Feed
- Permalink
- Notify Moderator
Mar 16, 2015
10:22 AM
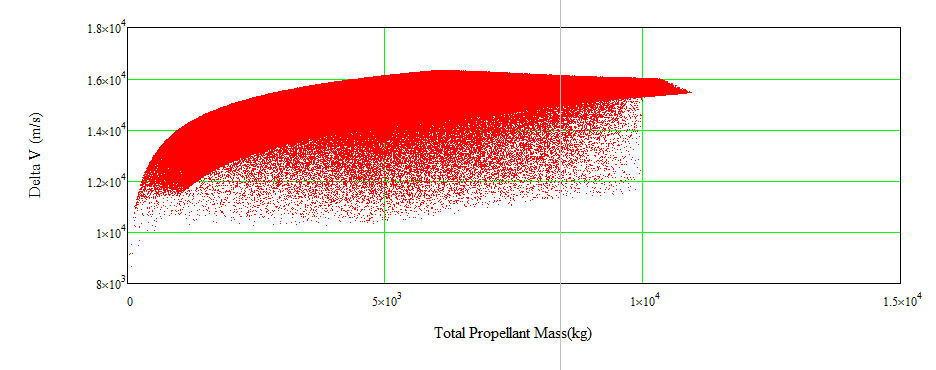
Ok - lets put the question around a different way. I have a plot with 10^6 points on it, example below. The array used to plot it contains more columns. I want to be able to pick a point and find it in the array and then view other columns. I tried using the "match" function but because TRACE doesn't give me enough sig figs it fails to locate the values.
Any ideas how to select a point on the plot and find it in an array
Mar 16, 2015
10:37 AM
- Mark as New
- Bookmark
- Subscribe
- Mute
- Subscribe to RSS Feed
- Permalink
- Notify Moderator
Mar 16, 2015
10:37 AM
You could start by homing in on the region of interest. Alter the start and end of the range on each axis (do this directly on the graph). Repeat until you are just viewing a few points. Apply the process I noted above to the data in the columns that are plotted. Then use "match".
Do you have to do the point selection by hand? What criteria is the selected point based on?
Alan.
Mar 16, 2015
12:25 PM
- Mark as New
- Bookmark
- Subscribe
- Mute
- Subscribe to RSS Feed
- Permalink
- Notify Moderator
Mar 16, 2015
12:25 PM
This is an optimisation study - there is no "correct" answer and so it is difficult to define a mathematical point selection process. It is actually a model of multi stage rockets. It is very difficult, mathematically to find the optimum strategy for staging so I did a Monte Carlo type approach and chose stage sizes at random - a million times. I am looking for a delta V of about 14200m/s and there are obviously numerous points where that is achieved on the plot. But I also have certain limitations on stage sizes, mach number and position at the end of each stage - and this information is contained in further columns in the data array. Hence I would like to work my way along the 14200 line and view the data associated with each point. Perhaps if I excluded all the data that was outside 14200 + or - a bit I could reduce the data set to manageable proportions and perhaps match would work ...
Mar 16, 2015
12:34 PM
- Mark as New
- Bookmark
- Subscribe
- Mute
- Subscribe to RSS Feed
- Permalink
- Notify Moderator
Mar 16, 2015
12:34 PM
Surely you can just subtract 14200 from all of your delta V values, so the points you are interested in are close to zero.
Mar 17, 2015
05:54 AM
- Mark as New
- Bookmark
- Subscribe
- Mute
- Subscribe to RSS Feed
- Permalink
- Notify Moderator
Mar 17, 2015
05:54 AM
Instead of choosing by hand, why not use a routine similar to the one sketched in the attached.
Alan

