
Turn on suggestions
Auto-suggest helps you quickly narrow down your search results by suggesting possible matches as you type.
Showing results for
Turn on suggestions
Auto-suggest helps you quickly narrow down your search results by suggesting possible matches as you type.
Showing results for
Options
- Subscribe to RSS Feed
- Mark Topic as New
- Mark Topic as Read
- Float this Topic for Current User
- Bookmark
- Subscribe
- Mute
- Printer Friendly Page
graphing vertical line automatically
Oct 04, 2011
12:30 PM
- Mark as New
- Bookmark
- Subscribe
- Mute
- Subscribe to RSS Feed
- Permalink
- Notify Moderator
Oct 04, 2011
12:30 PM
graphing vertical line automatically
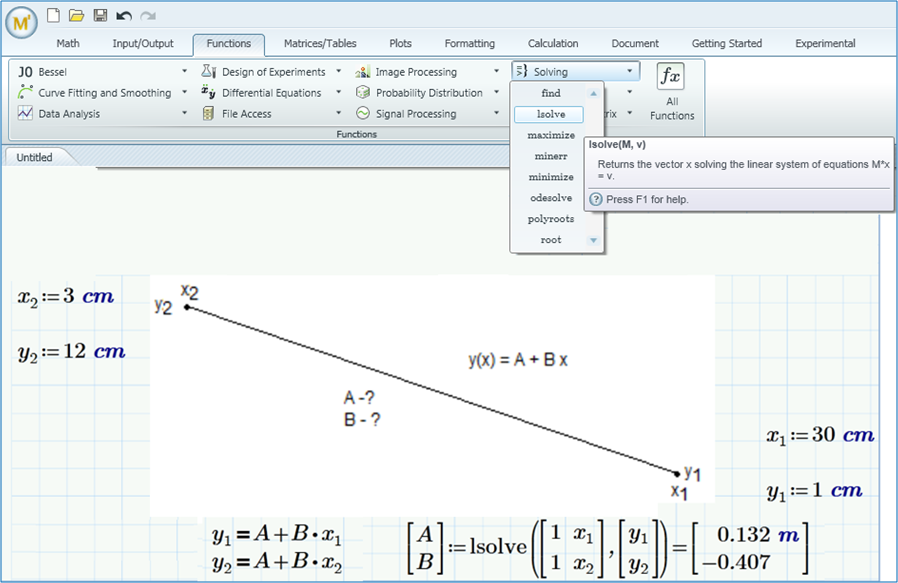
Working on a larger worksheet a ran into a problem. I couldn't solve. I've broken it down to a simpler problem.
The simple task is, to find the equation und graph a line given by to points. While finding the equation works fine, even with vertical lines, I experience problems to graph automatically, if the line is vertical.
See attached worksheet (MC14 filed as MC11)
Any ideas are welcome any maybe there are better ideas for achieving the equation, too.
Regards
WR
Labels:
- Labels:
-
Other
16 REPLIES 16
Oct 04, 2011
12:58 PM
- Mark as New
- Bookmark
- Subscribe
- Mute
- Subscribe to RSS Feed
- Permalink
- Notify Moderator
Oct 04, 2011
12:58 PM
>The simple task is, to find the equation [and graph] a line given by two points.
Only in Mathcad Prime:
Oct 04, 2011
01:01 PM
- Mark as New
- Bookmark
- Subscribe
- Mute
- Subscribe to RSS Feed
- Permalink
- Notify Moderator
Oct 04, 2011
01:01 PM
While finding the equation works fine, even with vertical lines
Try please the operator on eror in Mathcad ** and the operator try in Mathcad Prime.
Oct 04, 2011
02:54 PM
- Mark as New
- Bookmark
- Subscribe
- Mute
- Subscribe to RSS Feed
- Permalink
- Notify Moderator
Oct 04, 2011
02:54 PM
Thanks for trying, but first I don't use Prime (looks to me more like a preview version, lacking of symbolics, etc.).
I have played around with onerror, but it didn't worked out. Think, it is not intended to be used with symbolic expressions/evaluations. I can't catch an undefined function with it or an error in a function definition.
The main goal is that a linear equation is given in the Mathcad-usual form with the boolean equal sign. This equation could have the form y=a.x+b OR x=c and I want to graph it in both cases (and failed to graph it in the latter case). Any solutions are welcome.
On former occasions I often was searching for a possibility to manage part or all of an equation. E.g. extracting the lefthand or righthand side and assign it to a variable or applying an operation (e.g. adding the same term) on both sides of an equation. It would also have been helpful sometimes if I could transform an euqation or another mathematical term into a textstring, manipulate it there and transform it back. I guess, that these kinds of operations are not available in Mathcad because for MC an equation is a simple boolean expression which is subject to be evaluated, but not to be manipulated in the aforementioned ways. If that assumption is wrong and i simply missed the right way, please tell me.
Regards
WR
Oct 04, 2011
04:12 PM
- Mark as New
- Bookmark
- Subscribe
- Mute
- Subscribe to RSS Feed
- Permalink
- Notify Moderator
Oct 04, 2011
04:41 PM
- Mark as New
- Bookmark
- Subscribe
- Mute
- Subscribe to RSS Feed
- Permalink
- Notify Moderator
Oct 04, 2011
04:41 PM
Thank you, Fred, think that was a helpful answer..
In your worksheet I don't see the vertical g(x) plotted, unless I change your 10^-15 up to 10^-5, which is still optically precise enough. Unfortunately in the original context there ist more than one equation which should be plotted and could be vertical and the equations are derived from a more complex situation. So it would be a lot more work to apply your approximation, but I think it could be done.
What I need/want are the exact(=symbolically) derived equations, but for graphing purpose an approximation like yours will suffice.
It would be helpful if there were a way to evaluate the boolean expression Eq and then decide, what to do, but it seems that this is not possible. I am thinking of something like "if LeftHandSideOf(Eq) is x then ..." or "if Eq is not solvable to y then ...". But it seems that this is beyond the possibilities of MC.
Thanks for your effort
WR
Oct 04, 2011
11:42 PM
- Mark as New
- Bookmark
- Subscribe
- Mute
- Subscribe to RSS Feed
- Permalink
- Notify Moderator
Oct 05, 2011
06:53 AM
- Mark as New
- Bookmark
- Subscribe
- Mute
- Subscribe to RSS Feed
- Permalink
- Notify Moderator
Oct 05, 2011
06:53 AM
I gave it a try, any closer to what you want?
Yes, thanks a lot. As manipulating boolean equations seems not to be possible it looks like one can not get much more closer. I had already played around with the idea of my function Equ giving back a vector, but with no good results. First attempt was that the first compononent would be the equation and the second an indicator to be able to decide whether the line is vertical or not. I got stuck when it came to the plotting part. Second attempt was a 3dimensional vector, where the two extra components would depict the line equations in parameter form. This worked, but I disliked the necessity for a range variable.
I like a lot your way of plotting two function and the use of NaN to avoid plotting the "wrong" one.
Only drawback is, that the number of plots is doubled as are the formatting options.
Is there a way to pack the two in one pack? As far as I have read about plotting family of curves I never had read that this could be done without range variables using functions and quickplot.
Many thanks, I think Iwill use your idea anyway
Regards
WR
Oct 05, 2011
11:00 AM
- Mark as New
- Bookmark
- Subscribe
- Mute
- Subscribe to RSS Feed
- Permalink
- Notify Moderator
Oct 05, 2011
11:00 AM
Winfrod
If you can plot using matrices, and if you set the limits of the graph, you can use the same limits (as variables) to plot?
Oct 05, 2011
01:35 PM
- Mark as New
- Bookmark
- Subscribe
- Mute
- Subscribe to RSS Feed
- Permalink
- Notify Moderator
Oct 05, 2011
01:35 PM
If you can plot using matrices, and if you set the limits of the graph, you can use the same limits (as variables) to plot?
Oh yes, one of those "why didn't I thought of that?"-moments. In my original worksheet the plotlimits are already calculated an in variables, so I can apply your idea with minimal change. Unfortunately I dont't know those limits, when I calculate the line-equations, but a second function will take care of that.
We are now far away from what I have asked for, though. That was simply(?sic!) plotting a linear function given by a boolean equation and we end up of plotting not a single function but a couple of matrices. But it will do the job pretty well and so I have to live with the limitations of Mathcad and that kind of workaround.
I also liked Freds idea of approximating vertical lines with steeply sloping lines, but it seems we are running into numerical problems with that approach.
Thanks and regards
WR
Oct 05, 2011
07:05 AM
- Mark as New
- Bookmark
- Subscribe
- Mute
- Subscribe to RSS Feed
- Permalink
- Notify Moderator
Oct 05, 2011
10:44 AM
- Mark as New
- Bookmark
- Subscribe
- Mute
- Subscribe to RSS Feed
- Permalink
- Notify Moderator
Oct 05, 2011
10:44 AM
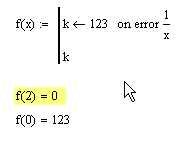
How about this?
Well done, thanks! It should work, as far as I can see, but it does not work for NON-vertical lines!?. It seems that k is set to zero there and so I get a horizontal line.
Strange effects with vertical lines, too. Depending an the exponent value (which you had set to 10) it is sometiomes drawn, sometimes not and in one case (10^6) even at a wrong position. I got rid of the range variable x to be able to deal with more general values. The vertcal lines ar drawn only for positive y-values. For debugging purpose I introduced again a range-var for x with a rather large step and saw a v-shaped graph as you would expect, if you take the absolute value of the function - strange.
I think, that your idea should work, but fails because of rounding errors, numbers beeing too large or whatever.
Regards
WR
PS: I have just tried it and the "on error" operator does not work correctly in the context of a program. At least not when used with a local variable. Is this a known bug?
Oct 06, 2011
07:00 PM
- Mark as New
- Bookmark
- Subscribe
- Mute
- Subscribe to RSS Feed
- Permalink
- Notify Moderator
Oct 06, 2011
07:00 PM
On error doesn't work in a program?
Okay, we can go around that!
Oct 06, 2011
08:13 PM
- Mark as New
- Bookmark
- Subscribe
- Mute
- Subscribe to RSS Feed
- Permalink
- Notify Moderator
Oct 06, 2011
08:13 PM
Hi Fred,
Good work.
But I am not sure what Winfrod wants, he is only showing a small part.
Numerically finding an equation for a line is easy, and showing on a graph is easy just by plotting two points.
He seems to want a program that provides symbolic equations for what ever reason. Maybe I am wrong.
Oct 06, 2011
03:39 PM
- Mark as New
- Bookmark
- Subscribe
- Mute
- Subscribe to RSS Feed
- Permalink
- Notify Moderator
Oct 06, 2011
03:39 PM
winfrod rager wrote:
Working on a larger worksheet a ran into a problem. I couldn't solve. I've broken it down to a simpler problem.
The simple task is, to find the equation und graph a line given by to points. While finding the equation works fine, even with vertical lines, I experience problems to graph automatically, if the line is vertical.
See attached worksheet (MC14 filed as MC11)
Any ideas are welcome any maybe there are better ideas for achieving the equation, too.
Regards
WR
Maybe so:
Oct 07, 2011
09:07 AM
- Mark as New
- Bookmark
- Subscribe
- Mute
- Subscribe to RSS Feed
- Permalink
- Notify Moderator
Oct 13, 2011
06:07 AM
- Mark as New
- Bookmark
- Subscribe
- Mute
- Subscribe to RSS Feed
- Permalink
- Notify Moderator
Oct 13, 2011
06:07 AM
Thanks for all the helpful answers and the time you all have put in. I now have the choice among at least three different approches (Wayne's matrix, Fred's approximation, which seems to works now and what looks like a very interesting elegant way introduced by Vyacheslav). I'll be playing around abit with those an we'll see what I can come up with.
Thanks to all of you
WR

