
Turn on suggestions
Auto-suggest helps you quickly narrow down your search results by suggesting possible matches as you type.
Showing results for
Turn on suggestions
Auto-suggest helps you quickly narrow down your search results by suggesting possible matches as you type.
Showing results for
Community Tip - You can Bookmark boards, posts or articles that you'd like to access again easily! X
- Community
- ThingWorx
- ThingWorx Developers
- Pie chart Widget not working
Options
- Subscribe to RSS Feed
- Mark Topic as New
- Mark Topic as Read
- Float this Topic for Current User
- Bookmark
- Subscribe
- Mute
- Printer Friendly Page
Pie chart Widget not working
Apr 10, 2024
02:31 AM
- Mark as New
- Bookmark
- Subscribe
- Mute
- Subscribe to RSS Feed
- Permalink
- Notify Moderator
Apr 10, 2024
02:31 AM
Pie chart Widget not working
Hello,
Good Morning,
I am trying to use pie chart widget in thingworx mashup, but not able to achieve the output.
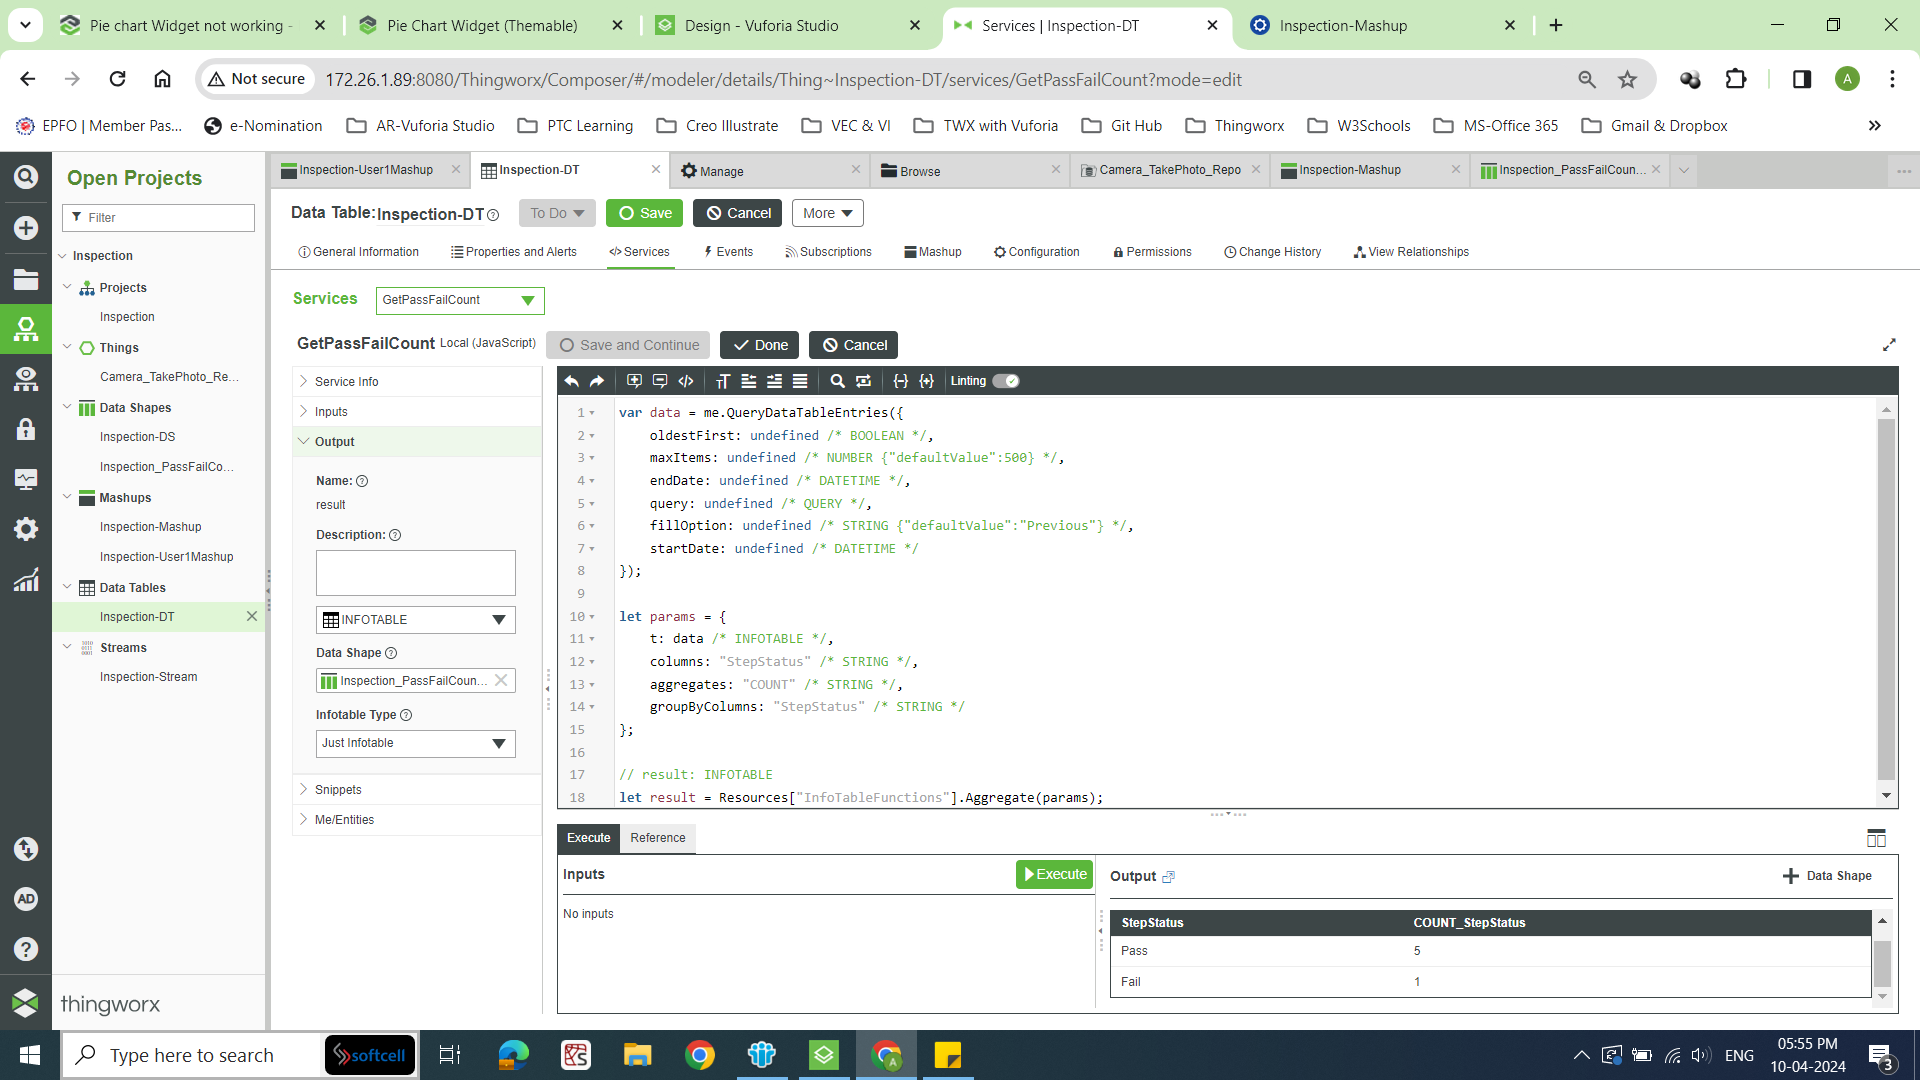
I have a service which has infotable as an output(Service.png). I have bound all data of that service to pie-chart widget(Binding.png) in thingworx mashup. After viewing the mashup it says no data in mashup(Mashup.png).
I have attached the reference images, can anyone help me out with the same.
Thanks in Advance.
Regards,
Aditya Gupta
Solved! Go to Solution.
1 ACCEPTED SOLUTION
Accepted Solutions
Apr 11, 2024
03:51 AM
- Mark as New
- Bookmark
- Subscribe
- Mute
- Subscribe to RSS Feed
- Permalink
- Notify Moderator
Apr 11, 2024
03:51 AM
What your service returns (columns StepStatus and COUNT_StepStatus) does not match the Datashape you defined as shape for the result infotable. Those need to match because in a mashup, you can only bind the fields defined in the Shape, not the ones that are actually returned by the service. In your case it might be the easiest after the aggregate to Run to RenameField service so the infotable columns match the ones from the datashape.
result.
Resources["InfoTableFunctions"].RenameField({t: result, from: "StepStatus", to: "PropertyName"});
Resources["InfoTableFunctions"].RenameField({t: result, from: "COUNT_StepStatus", to: "Count"});
In your mashup, bind "All Data" from the service to "Data" of the pie chart, and set LabelField to PropertyName and ValueField to Count.
4 REPLIES 4
Apr 10, 2024
03:17 AM
- Mark as New
- Bookmark
- Subscribe
- Mute
- Subscribe to RSS Feed
- Permalink
- Notify Moderator
Apr 10, 2024
03:17 AM
You will have to bind ValueField and LabelField with values from your result infotable, so they would be either StepStatus or Count_StepStatus, not "Propertyname" as in the screenshot.
Also the service Output ("result") would have to be not only set to Infotable, but needs a datashape assigned.
Apr 10, 2024
08:36 AM
- Mark as New
- Bookmark
- Subscribe
- Mute
- Subscribe to RSS Feed
- Permalink
- Notify Moderator
Apr 10, 2024
08:36 AM
Hi @Rocko ,
Actually I have service named GetPassFailCount with Inspection_PassFailCount-DS as the datashape which has field definiton (PropertyName & Count).
Hence in the previous screenshot the DataField was set to PropertyName.
Can you guide me in what way I can show the pass/fail count in pie chart.
I have QueryDataEntries which has a column named StepStatus with Pass/Fail as its values.
Also the GetPassFailCount service counts the number of pass/fail values of QueryDataTableEntries Service.
Apr 11, 2024
03:51 AM
- Mark as New
- Bookmark
- Subscribe
- Mute
- Subscribe to RSS Feed
- Permalink
- Notify Moderator
Apr 11, 2024
03:51 AM
What your service returns (columns StepStatus and COUNT_StepStatus) does not match the Datashape you defined as shape for the result infotable. Those need to match because in a mashup, you can only bind the fields defined in the Shape, not the ones that are actually returned by the service. In your case it might be the easiest after the aggregate to Run to RenameField service so the infotable columns match the ones from the datashape.
result.
Resources["InfoTableFunctions"].RenameField({t: result, from: "StepStatus", to: "PropertyName"});
Resources["InfoTableFunctions"].RenameField({t: result, from: "COUNT_StepStatus", to: "Count"});
In your mashup, bind "All Data" from the service to "Data" of the pie chart, and set LabelField to PropertyName and ValueField to Count.
Apr 18, 2024
02:08 AM
- Mark as New
- Bookmark
- Subscribe
- Mute
- Subscribe to RSS Feed
- Permalink
- Notify Moderator
Apr 18, 2024
02:08 AM
Hi @Rocko ,
I changed the Field Definitions of "Inspection_PassFailCount-DS" to (StepStatus & COUNT_StepStatus) so, that
it matches the output of "GetPassFailCount" service. Also bound the all data & followed the procedure as mentioned by you & it worked.
Thank you for your guidance.
Best Regards,
Aditya Gupta.


