
Turn on suggestions
Auto-suggest helps you quickly narrow down your search results by suggesting possible matches as you type.
Showing results for
Turn on suggestions
Auto-suggest helps you quickly narrow down your search results by suggesting possible matches as you type.
Showing results for
Community Tip - You can subscribe to a forum, label or individual post and receive email notifications when someone posts a new topic or reply. Learn more! X
- Community
- Creo+ and Creo Parametric
- Customization
- Missing the maximum, global sens and optimiser
Options
- Subscribe to RSS Feed
- Mark Topic as New
- Mark Topic as Read
- Float this Topic for Current User
- Bookmark
- Subscribe
- Mute
- Printer Friendly Page
Missing the maximum, global sens and optimiser
Aug 10, 2015
04:23 AM
- Mark as New
- Bookmark
- Subscribe
- Mute
- Subscribe to RSS Feed
- Permalink
- Notify Moderator
Aug 10, 2015
04:23 AM
Missing the maximum, global sens and optimiser
Hi,
Bear with me, a fairly long question and based on the global sensitivity plot below
Can anyone suggest how to find C and D?
Is there a function that can be used as a computed measure in a global sensitivity study that stores the maximum or minimum value of another variable?

It is clear by visual inspection that the global max and min of the function is at C and D.
The optimiser will find A and B.
The reasons for this:
- The x variable moves from 0 to 360.
- The optimiser looks at the local gradient.
- To maximise the function it starts at x=0 (A) and moves toward B because the gradient is +ve in that direction
- Once it gets to B, all gradients are then -ve so it stops and reports the figure at point B
- To minimise the function it starts at x=0 (A) and realises that moving to the right is a +ve gradient and therefore does not go toward B
- The optimiser cannot go to the left and toward E in the direction of the downward gradient because the x variable given to the optimiser STARTS at 0 and progresses to 360. (even though it is part of the same curve segment when the graph is wrapped around because in my case, the x variable is angle in degrees, the optimiser cannot go below 0)
Immediate thoughts are:
- You have the global graph so what's the problem. It's C and D. Move on.
- I have a lots and lots of measures, lots of geometries, lots of load cases. Graphing them all will result in repetitive strain injury.
- The method needs to be as automated as possible.
- Why don't you change the start angle
- The model angle relative to world is arbitrary
- Geometry is variable
- Loading is variable
- I would need to know what to change the start angle to
In the instance where the function height (shown in green) that A and B lie on is within the optimiser tolerance, the optimiser will put A and B are at the same location; at A. This may in of itself not be an issue because it is telling us that the function is flat and this is useful information. The optimiser realises that in order to change the value of the measure on this flat function it has to move a very long way from zero. It doesn't do this, the optimiser is short sighted and can't see the quantum leap to C because it's too far away.
Reducing the optimiser tolerance will find point B with more accuracy.
QUESTIONS
Is there a function that can be used as a computed measure to store the maximum or minimum value of another variable?
So as the global sensitivity study moves from 0 to 360, the measure is continuously updated but only in one direction.
If there isn't, can we have one please?
Thanks
This thread is inactive and closed by the PTC Community Management Team. If you would like to provide a reply and re-open this thread, please notify the moderator and reference the thread. You may also use "Start a topic" button to ask a new question. Please be sure to include what version of the PTC product you are using so another community member knowledgeable about your version may be able to assist.
Labels:
- Labels:
-
General
8 REPLIES 8
Aug 10, 2015
08:28 AM
- Mark as New
- Bookmark
- Subscribe
- Mute
- Subscribe to RSS Feed
- Permalink
- Notify Moderator
Aug 10, 2015
08:28 AM
If the response curve is typical of all your geometries and loadcases, does it help if you run the optimiser twice, with start angles 180° apart, and take the higher/lower value from the pair using some fairly straightforward Excel? Thinking a little more, this may not address the wrapping problem... but perhaps a further selective re-run of those cases that report either 0 or 360 as a max/min?
Aug 10, 2015
09:57 AM
- Mark as New
- Bookmark
- Subscribe
- Mute
- Subscribe to RSS Feed
- Permalink
- Notify Moderator
Aug 10, 2015
09:57 AM
Hi Jonathan,
Good idea,
yes the response curve is typical. (96 of them) I didn't carry out 96 global studies, just 96 optimisations knowing that this is happening in the background. I was looking for ideas before going for the global studies.
I shall begin the optimiser 180 deg out for each case. 96 optimiser goals is easier than 96 global sens graphs.
(still be nice to have a computed measure to capture the max/min in a GS though, then there would be no doubt)
Thanks
Aug 10, 2015
09:59 AM
- Mark as New
- Bookmark
- Subscribe
- Mute
- Subscribe to RSS Feed
- Permalink
- Notify Moderator
Aug 10, 2015
09:59 AM
That is,,,, 96 more optimiser runs (96 x 2 in total) is better than 96 global graphs.
Aug 12, 2015
12:23 PM
- Mark as New
- Bookmark
- Subscribe
- Mute
- Subscribe to RSS Feed
- Permalink
- Notify Moderator
Aug 12, 2015
12:23 PM
Actually, just noticed I need to go from 0 to -360 as well. In some cases my point E is lower than my point D.
That's 3 studies for each max and each min.
Aug 11, 2015
04:07 AM
- Mark as New
- Bookmark
- Subscribe
- Mute
- Subscribe to RSS Feed
- Permalink
- Notify Moderator
Aug 11, 2015
04:07 AM
Creo Simulate's optimisers (GDP and SQP) are not suitable for discontinuous goal functions. I vaguely recall that the BMX-module (Behavioral Modeling Extension) has some other optimisation techniques. It should be possible to reference a Creo Simulate analysis from BMX, and run the optimisation there. This could be worth looking into.
Aug 12, 2015
03:22 AM
- Mark as New
- Bookmark
- Subscribe
- Mute
- Subscribe to RSS Feed
- Permalink
- Notify Moderator
Aug 12, 2015
03:22 AM
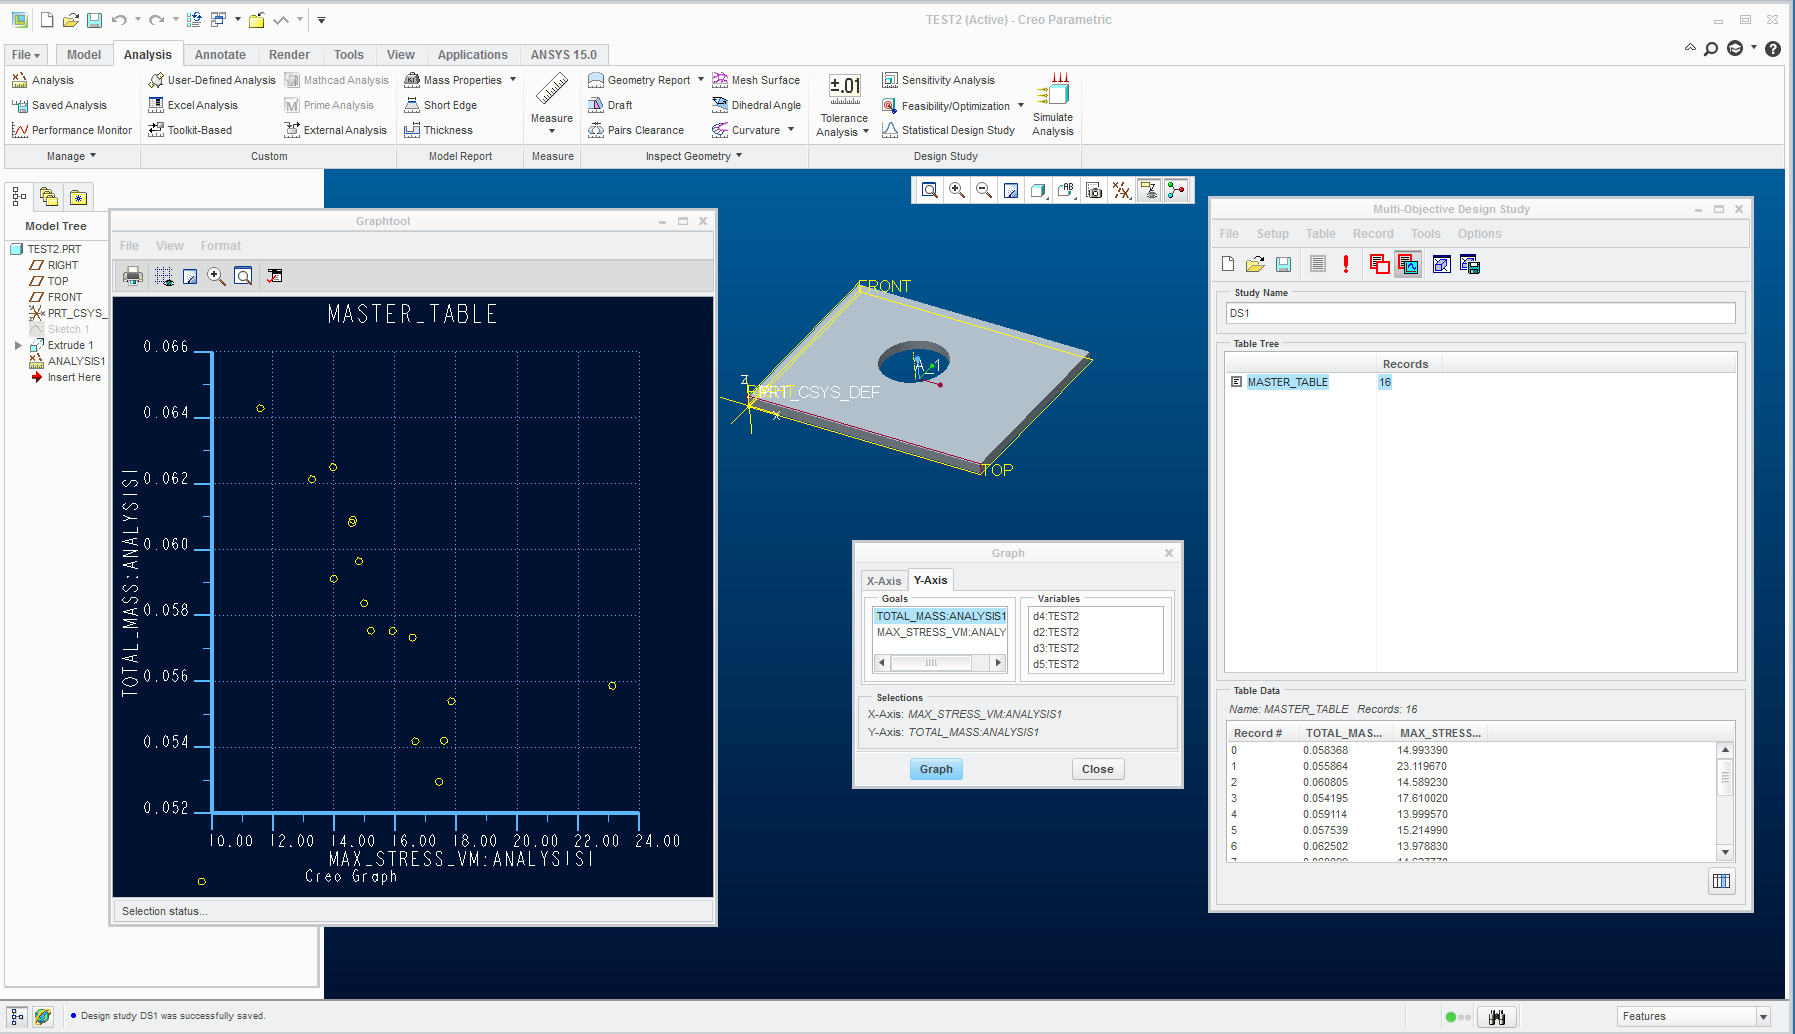
I have now played around a bit with the BMX. You can there do statistical design studies, i.e. "experiments" where you can make multi objective design studies. As I understand it, the default assumption is that design variables are uniformly distributed between their min and max, but my understanding after a few minutes of testing, is that you can also assign statistical distributions to design variables, and as a result, have the probability of stresses etc. exceeding a certain limit for example. Here's a screenshot of a very simple case: a plate with a hole. Hole diam and positions and plate thickness were altered uniformely distributed between their min/max. 16 experiments...
Aug 12, 2015
01:04 PM
- Mark as New
- Bookmark
- Subscribe
- Mute
- Subscribe to RSS Feed
- Permalink
- Notify Moderator
Aug 12, 2015
01:04 PM
Mats,
I toyed with the idea of using BMX and it's promising pseudo stochastic opportunities.
But I dismissed it because about a year and a half ago I tried using it on a project and very quickly ended up raising cases:
these are SPRs with 'Evaluating' as the status up to Creo4.0
I could have raised more as general usability was poor and I felt as if I was testing the s/w and reverse engineering it's operation. It was fighting me at every turn as I tried to pick ways through to get answers. I think it should be given to companies to stress (in the banking sense and not the engineering sense) on real engineering problems involving simulate to get the product into shape.
Documentation was not extensive, file and directory behaviour foreign and immediate CS unable to help (they cannot be experts in everything!).
So our BMX maintenance lapsed as a result and I would need some significant persuasion to spend more time (and money) on it.
Sad but true.
Aug 13, 2015
07:45 AM
- Mark as New
- Bookmark
- Subscribe
- Mute
- Subscribe to RSS Feed
- Permalink
- Notify Moderator
Aug 13, 2015
07:45 AM
Thanks for the input... I've only played around with the statistical analysis for a few minutes so I obviously have no real experience from it. I've had use for the BMX in other contexts though; regular design studies and optimization. There it can be useful... I was designing a rock crusher chamber and needed to minimise the crushing chamber (i.e. maximize size reduction), while at the same time maintaining a certain particle size at the top of the chamber and also keeping the nip angle between chambers below a certain maximum value. The BMX drew up the liner profile nicely.
Announcements
Top Tags
