
Turn on suggestions
Auto-suggest helps you quickly narrow down your search results by suggesting possible matches as you type.
Showing results for
Turn on suggestions
Auto-suggest helps you quickly narrow down your search results by suggesting possible matches as you type.
Showing results for
Community Tip - Did you know you can set a signature that will be added to all your posts? Set it here! X
Options
- Subscribe to RSS Feed
- Mark Topic as New
- Mark Topic as Read
- Float this Topic for Current User
- Bookmark
- Subscribe
- Mute
- Printer Friendly Page
Signal averaging with Mathcad14
Sep 03, 2015
11:34 AM
- Mark as New
- Bookmark
- Subscribe
- Mute
- Subscribe to RSS Feed
- Permalink
- Notify Moderator
Sep 03, 2015
11:34 AM
Signal averaging with Mathcad14
Hello everyone,
Please I want to know the way of using the signal averaging in Mathcad 14. I have three signal tests and I want to do averaging for their spectrum. Please if anyone have an experience with that I will be so grateful to email me on " -" with any useful information.
Best Regards
Solved! Go to Solution.
Labels:
- Labels:
-
Other
1 ACCEPTED SOLUTION
Accepted Solutions
Sep 04, 2015
03:40 PM
- Mark as New
- Bookmark
- Subscribe
- Mute
- Subscribe to RSS Feed
- Permalink
- Notify Moderator
Sep 04, 2015
03:40 PM
sabah al-fartosy wrote:
So, do you have the best way to do the averaging for the signals, I mean the steps in Mathcad.
Best way? Depends upon how generalized you wish to make the worksheet (eg, how many data sets you want to analyze). Assuming a one-off, this is a simple method:
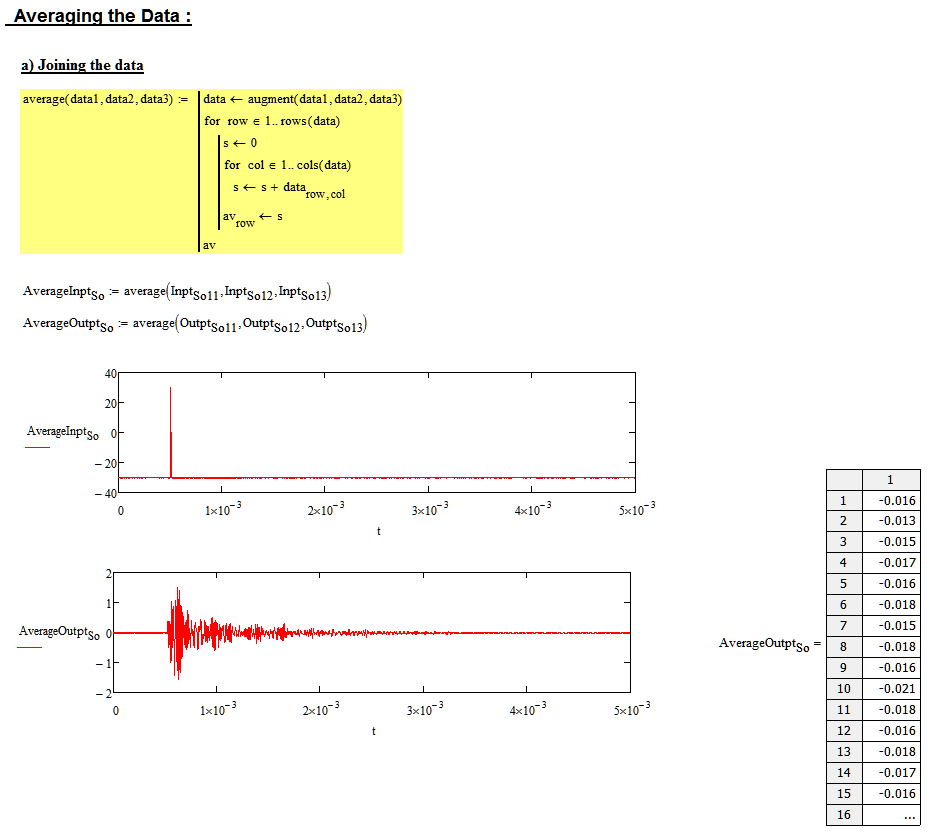
Stuart
24 REPLIES 24
Sep 03, 2015
06:12 PM
- Mark as New
- Bookmark
- Subscribe
- Mute
- Subscribe to RSS Feed
- Permalink
- Notify Moderator
Sep 03, 2015
06:12 PM
sabah al-fartosy wrote:
Hello everyone,
Please I want to know the way of using the signal averaging in Mathcad 14. I have three signal tests and I want to do averaging for their spectrum. Please if anyone have an experience with that I will be so grateful to email me on " -" with any useful information.
It's usual to post information within the Mathcad Community rather than email people. That way you can get a variety of thoughts and advice on any Mathcad-related subject, and it also helps others who may have similar problems. A quick web search on "signal averaging in Mathacad" (duck-duck-go rather than google) reveals several useful webpages, including this one:cips.colorado.edu/mathcad/12_Circuit_Signal_Averaging.pdf
Stuart
Sep 03, 2015
07:21 PM
- Mark as New
- Bookmark
- Subscribe
- Mute
- Subscribe to RSS Feed
- Permalink
- Notify Moderator
Sep 03, 2015
07:21 PM
If you want to average N signals just add them, and divide the result by N. Or is there something more involved about what you want to do?
As Stuart has said, nobody is likely to email you with an answer. Answers to forum questions are posted to the forums. There are three main reasons for this:
1) Others can possibly benefit from the answer
2) We don't like to spend time answering a question that someone else has already answered, and with private emails there is no way to know whether the question has been answered.
3) Generally, most of us don't like to give out our private email addresses.
Sep 03, 2015
07:43 PM
- Mark as New
- Bookmark
- Subscribe
- Mute
- Subscribe to RSS Feed
- Permalink
- Notify Moderator
Sep 03, 2015
07:43 PM
Richard Jackson wrote:
If you want to average N signals just add them, and divide the result by N. Or is there something more involved about what you want to do?
As Stuart has said, nobody is likely to email you with an answer. Answers to forum questions are posted to the forums. There are three main reasons for this:
1) Others can possibly benefit from the answer
2) We don't like to spend time answering a question that someone else has already answered, and with private emails there is no way to know whether the question has been answered.
3) Generally, most of us don't like to give out our private email addresses.
I suspect, given that the original message mentioned the spectrum, Sabah may want to average the FFTs rather than the average the signals and then take the FFT.
Stuart
Sep 04, 2015
06:36 AM
- Mark as New
- Bookmark
- Subscribe
- Mute
- Subscribe to RSS Feed
- Permalink
- Notify Moderator
Sep 04, 2015
06:36 AM
I assumed he already had the spectra, because he only asked about averaging, not how to get spectra from a time domain signal 
Sep 04, 2015
07:03 AM
- Mark as New
- Bookmark
- Subscribe
- Mute
- Subscribe to RSS Feed
- Permalink
- Notify Moderator
Sep 04, 2015
07:03 AM
Richard Jackson wrote:
I assumed he already had the spectra, because he only asked about averaging, not how to get spectra from a time domain signal
Ah, OK. I wasn't sure, given the phrasing "three signal tests" rather than, say, "three test signals", whether Sabah has English as a first language or was yet sufficiently well versed in the domain language to be that precise. I duly apologize if Sabah 's an an expert in the field and has a better grasp of the Queen's English than wot I do, guvn'r. 
Stuart
Sep 03, 2015
07:31 PM
- Mark as New
- Bookmark
- Subscribe
- Mute
- Subscribe to RSS Feed
- Permalink
- Notify Moderator
Sep 03, 2015
07:31 PM
Hello my friends,
I am so sorry to be rude by putting my email. This is my first comment and I thought it will be easy to communicate with others. I am really thankful for your valuable comments and I agree with both that other need to share the same information.
Best Regards,
Sabah
Sep 04, 2015
04:30 AM
- Mark as New
- Bookmark
- Subscribe
- Mute
- Subscribe to RSS Feed
- Permalink
- Notify Moderator
Sep 04, 2015
04:30 AM
Hi Sabah,
You will also be useful to see a built Mathcad package extensions "Signal Processing" (in main programm menu select "Help" --> "E-books" --> "Signal Processing'').
Sep 04, 2015
06:41 AM
- Mark as New
- Bookmark
- Subscribe
- Mute
- Subscribe to RSS Feed
- Permalink
- Notify Moderator
Sep 04, 2015
06:41 AM
Thank you my friends for your comments. Actually, the mean goal of my question is to get the steps that I should follow up in order to determine the average of three frequency spectrum signals in Mathcad 14. So I want to see if any one have an experience in this topic which can be helpful to me to do this process,
Best Regards,
Sep 04, 2015
09:53 AM
- Mark as New
- Bookmark
- Subscribe
- Mute
- Subscribe to RSS Feed
- Permalink
- Notify Moderator
Sep 04, 2015
09:53 AM
We need more information. Do you have the signals already in Mathcad? Do you need to read them from files? if so, what's the file format? Are the frequency axes for the three signals identical, or are there registration issues that have to be dealt with? Doing this in Mathcad is not difficult, but without more information it's hard to give you any useful advice.
Even better, can you attach a file (or files) containing the spectra? (Click on "Use advanced editor" at the top right of the edit dialog)
Sep 04, 2015
10:19 AM
- Mark as New
- Bookmark
- Subscribe
- Mute
- Subscribe to RSS Feed
- Permalink
- Notify Moderator
Sep 04, 2015
10:19 AM
Hello Richard,
Thank you so much for your post. The signals are processed already inside the Mathcad and I did all operations for them (removing DC components, Zero-padding and else). The signals have the same length for both time and frequency domains. As I mentioned in my previous post I want to learn the procedure to averaging the signals in Mathcad 14 ( Mathematical expressions). Also, I have last question is the averaging can be did before and after the fft or its restricted for a certain case.
Best Regards,
Sabah
Sep 04, 2015
10:30 AM
- Mark as New
- Bookmark
- Subscribe
- Mute
- Subscribe to RSS Feed
- Permalink
- Notify Moderator
Sep 04, 2015
10:30 AM
sabah al-fartosy wrote:
Hello Richard,
Thank you so much for your post. The signals are processed already inside the Mathcad and I did all operations for them (removing DC components, Zero-padding and else). The signals have the same length for both time and frequency domains. As I mentioned in my previous post I want to learn the procedure to averaging the signals in Mathcad 14 ( Mathematical expressions). Also, I have last question is the averaging can be did before and after the fft or its restricted for a certain case.
Hi Sabah,
Here's another worksheet you may find of interest: www.uvm.edu/~dhitt/me124/FFT-averaging-demo.pdf
If you could post your current worksheet, that might give us a better of view of what you're trying to achieve?
Stuart
Sep 04, 2015
11:03 AM
- Mark as New
- Bookmark
- Subscribe
- Mute
- Subscribe to RSS Feed
- Permalink
- Notify Moderator
Sep 04, 2015
11:03 AM
Hello StuartBruff,
Thank your for your comment. I attached the Mathcad file with signal data files. I hope it will be helpful to get the idea behind my question. You will see inside the file I did all steps to processing the data and I need to do the averaging for the signals after doing the fft for them.
Best Regards,
Sep 04, 2015
12:39 PM
- Mark as New
- Bookmark
- Subscribe
- Mute
- Subscribe to RSS Feed
- Permalink
- Notify Moderator
Sep 04, 2015
12:39 PM
sabah al-fartosy wrote:
Hello StuartBruff,
Thank your for your comment. I attached the Mathcad file with signal data files. I hope it will be helpful to get the idea behind my question. You will see inside the file I did all steps to processing the data and I need to do the averaging for the signals after doing the fft for them.
Best Regards,
Hi Sabah,
I've had a quick scan through your worksheet. There were a couple of problems that prevented the worksheet running properly.
A. The actual numeric data from your oscilloscope records don't start until row 20, so you have to skip past these. I've written a small function that picks out the desired columns.
B. Your oscilloscope record column number indices were off by one.
Stuart
Sep 04, 2015
01:18 PM
- Mark as New
- Bookmark
- Subscribe
- Mute
- Subscribe to RSS Feed
- Permalink
- Notify Moderator
Sep 04, 2015
01:18 PM
Hello StuartBruff,
I appreciate your post and I want to clarify the following:
1- these data files (three) are recorded from the oscilloscope using a software called BenchVue from Keysight company and the software added an information until row 22 which I do not need them in Mathcad.
2- the files and the Mathcad work fine with me and there is no problem with them.
2- When I inserted these files inside Mathcad I removed 22 rows as I mentioned above and also removed all columns except the columns of ( time, input signal and output signal).
I am so happy to see you way to get the data from the files with no need to moderate the original data files.
Best Regards,
Sep 04, 2015
01:31 PM
- Mark as New
- Bookmark
- Subscribe
- Mute
- Subscribe to RSS Feed
- Permalink
- Notify Moderator
Sep 04, 2015
01:31 PM
sabah al-fartosy wrote:
Hello StuartBruff,
I appreciate your post and I want to clarify the following:
1- these data files (three) are recorded from the oscilloscope using a software called BenchVue from Keysight company and the software added an information until row 22 which I do not need them in Mathcad.
2- the files and the Mathcad work fine with me and there is no problem with them.
2- When I inserted these files inside Mathcad I removed 22 rows as I mentioned above and also removed all columns except the columns of ( time, input signal and output signal).
I am so happy to see you way to get the data from the files with no need to moderate the original data files.
I forgot to mention that you could have used the Data Input Properties dialog to select the data:

which is fine for a one-off use, or if you are very patient and like clicking in dialog boxes if you have lots of files, but it's a bit of pain and too much like work for my tastes. Consequently, I prefer using Mathcad functions to manipulate the data. It also makes it easier to modify a worksheet for different data formats.
Stuart
(I don't know how you removed the extra rows, but if you used the dialog box method, then the Data Range parameters weren't preserved in my copy)
Sep 04, 2015
01:44 PM
- Mark as New
- Bookmark
- Subscribe
- Mute
- Subscribe to RSS Feed
- Permalink
- Notify Moderator
Sep 04, 2015
01:44 PM
Hello StuartBruff,
I did what you mentioned when I inserted the data inside Mathcad. Please put all files ( the Mathcad and data) in one folder and try again I am sure the file will work.
Best Regards,
Sabah
Sep 04, 2015
01:51 PM
- Mark as New
- Bookmark
- Subscribe
- Mute
- Subscribe to RSS Feed
- Permalink
- Notify Moderator
Sep 04, 2015
01:51 PM
sabah al-fartosy wrote:
Hello StuartBruff,
I did what you mentioned when I inserted the data inside Mathcad. Please put all files ( the Mathcad and data) in one folder and try again I am sure the file will work.
That's what I did, Sabah. If the data components had read the data properly, Mathcad would have calculated the means without error, and I wouldn't have looked at the data files to see what their structure was. So I suppose it was lucky outcome from your point of view to know that you could pre-process the data within Mathcad.
I wonder why the row information was lost, though ...?
Stuart
Sep 04, 2015
02:18 PM
- Mark as New
- Bookmark
- Subscribe
- Mute
- Subscribe to RSS Feed
- Permalink
- Notify Moderator
Sep 04, 2015
02:18 PM
Hello StuartBruff,
I am thankful for your efforts and what you trying to do for me. So, do you have the best way to do the averaging for the signals, I mean the steps in Mathcad.
Regards,
Sep 04, 2015
03:40 PM
- Mark as New
- Bookmark
- Subscribe
- Mute
- Subscribe to RSS Feed
- Permalink
- Notify Moderator
Sep 04, 2015
03:40 PM
sabah al-fartosy wrote:
So, do you have the best way to do the averaging for the signals, I mean the steps in Mathcad.
Best way? Depends upon how generalized you wish to make the worksheet (eg, how many data sets you want to analyze). Assuming a one-off, this is a simple method:
Stuart
Sep 04, 2015
03:53 PM
- Mark as New
- Bookmark
- Subscribe
- Mute
- Subscribe to RSS Feed
- Permalink
- Notify Moderator
Sep 04, 2015
03:53 PM
Hello StuartBruff,
I am really so happy to see your post. It was so helpful and I got form it what I want. Thanks again my friend for your grateful help.
I have another request my friend. I want to do factorization for the three signals, can you please help me and show me the wright way for that in Mathcad.
Best Regards,
Sabah
Sep 04, 2015
05:05 PM
- Mark as New
- Bookmark
- Subscribe
- Mute
- Subscribe to RSS Feed
- Permalink
- Notify Moderator
Sep 04, 2015
05:05 PM
The two operations - averaging and DFT (discrete Fourier transform) - are both linear, so the order doesn't matter. You may average first and take a single Fourier transform of the average (fewer operations, so faster if that is an issue), or transform each waveform and average the resulting spectra. The latter allows review of each component transform if these are of interest for some reason. The end result will be the same in any case.
Lou
Sep 04, 2015
05:22 PM
- Mark as New
- Bookmark
- Subscribe
- Mute
- Subscribe to RSS Feed
- Permalink
- Notify Moderator
Sep 04, 2015
05:22 PM
Hello Lou,
Thank you for your comment,its awesome for me and I will use it in my work.
Best Regards,
Sabah
Sep 04, 2015
05:25 PM
- Mark as New
- Bookmark
- Subscribe
- Mute
- Subscribe to RSS Feed
- Permalink
- Notify Moderator
Sep 04, 2015
05:25 PM
the order doesn't matter.
It does if there are phase differences between the signals, and what you average after the FT is the magnitude spectrum.
Sep 05, 2015
03:45 PM
- Mark as New
- Bookmark
- Subscribe
- Mute
- Subscribe to RSS Feed
- Permalink
- Notify Moderator
Sep 05, 2015
03:45 PM
Richard, Sabah,
Agreed, but that is not the set of operations I described. Converting a complex number to its magnitude is a nonlinear operation, so this cannot be interchanged with other operations (in general). The following are equivalent:
1. N time signals averages to one time signal => complex DFT spectrum of the average time signal => magnitude of spectrum (if desired)
2. N time signals => N complex spectra using DFT => one averaged complex spectrum => magnitude of averaged spectrum
Averaging and DFT operations may be interchanged if they are performed one after the other. In some other cases, the result of the interchange may the same with one or more intervening operations, but this will depend on these new operations. In general, interchanging a sequence with nonlinear operators will yield different results.
Other cases also require care. For example, in many real data sets, some time alignment shift may be required, with a different time shift for each sample time waveform. Such pre-processing cannot be interchanged with subsequent averaging. In this case, time shift T before a DFT corresponds to a frequency dependent multiplier exp(jwT) after the DFT. {Timeshift T=>DFT} is equivalent to {DFT=>multiply by exp(jwT)}. I'm just trying to make the point that one needs to understand the operations used and the constraints in using them.
Lou

