
Turn on suggestions
Auto-suggest helps you quickly narrow down your search results by suggesting possible matches as you type.
Showing results for
Turn on suggestions
Auto-suggest helps you quickly narrow down your search results by suggesting possible matches as you type.
Showing results for
Community Tip - You can Bookmark boards, posts or articles that you'd like to access again easily! X
Options
- Subscribe to RSS Feed
- Mark Topic as New
- Mark Topic as Read
- Float this Topic for Current User
- Bookmark
- Subscribe
- Mute
- Printer Friendly Page
surface plot?
Apr 01, 2016
12:33 PM
- Mark as New
- Bookmark
- Subscribe
- Mute
- Subscribe to RSS Feed
- Permalink
- Notify Moderator
Apr 01, 2016
12:33 PM
surface plot?
To al,
How does one create a surface plot like the example attached in mcad?
Thanks
Regards
Labels:
- Labels:
-
Other
8 REPLIES 8
Apr 01, 2016
02:44 PM
- Mark as New
- Bookmark
- Subscribe
- Mute
- Subscribe to RSS Feed
- Permalink
- Notify Moderator
Apr 01, 2016
02:44 PM
How to plot it, or how to calculate the matrix of values for the plot?
Apr 01, 2016
04:14 PM
- Mark as New
- Bookmark
- Subscribe
- Mute
- Subscribe to RSS Feed
- Permalink
- Notify Moderator
Apr 01, 2016
04:14 PM
Looks like a contour plot, but you sure would have to give more information about the data plotted here, like Richard demanded.
Which version of the software do you have in mind - Mathcad (15 or below) or just Prime?
Apr 02, 2016
02:43 AM
- Mark as New
- Bookmark
- Subscribe
- Mute
- Subscribe to RSS Feed
- Permalink
- Notify Moderator
Apr 02, 2016
02:43 AM
Richard, Werner.
Thanks for the replies.
apologies in my rush to ask the question I didn't realized it was incomplete
working with mcad 14 and/or 15
interested in how to plot such data. I don't know how to set up the format of the data. I suspect it should be a function F(w1,w2)
I think the matrix is calculated as per query: Freq. Resp. Assurance Criteria (FRAC)
Apr 02, 2016
08:12 AM
- Mark as New
- Bookmark
- Subscribe
- Mute
- Subscribe to RSS Feed
- Permalink
- Notify Moderator
Apr 02, 2016
08:12 AM
> I suspect it should be a function F(w1,w2)
Correct, at least thats one way that would work. Providing your data just in form of matrices of values (tabled values for a rectangular area of w1 and w2 values) will work, too.
As soon as you can provide that function or the matrices you choose from the menu Insert/Graph/Contour Plot and you can go to format the plot as desired (select the ranges, color scheme, etc.). You may also use CreateMesh (if you can provide a function F) for a more convenient way to set the ranges and density.
One problem may be that Mathcad 15 and below does not provide the legend which is drawn at the right side of your picture. As far as I remember there are some older threads here in this forum showing some (cumbersome) ways to create that legend yourself.
WE
Apr 02, 2016
08:47 AM
- Mark as New
- Bookmark
- Subscribe
- Mute
- Subscribe to RSS Feed
- Permalink
- Notify Moderator
Apr 02, 2016
08:47 AM
I suspect that what you are looking for is something like this: https://en.wikipedia.org/wiki/Two-dimensional_correlation_analysis. What you show would be the asynchronous spectrum. That's not much more than a guess though, based on the title on your graph and the fact that the intensities range from 0 to 1. Creating such plots requires a sequence of spectra though, not just one spectrum.
Apr 02, 2016
10:50 AM
- Mark as New
- Bookmark
- Subscribe
- Mute
- Subscribe to RSS Feed
- Permalink
- Notify Moderator
Apr 02, 2016
10:50 AM
Thanks both of you for the pointer & explanation. I am definitely looking at something I have never seen or heard before. Brand new to me
It is all about correlation of 2 signals in the frequency domain so the wikipedia link looks right. Will need a bit of time to read it
I pullet out 2 spectrum I have lying around. There not of the same length (so not sure if it works!) but this can be "corrected" as it just for a test. I have attached an example
Q1: is there a way of setting up the equation so that one gets a value for the freq range w1,w2? at the moment I get one value so cannot create a surface/contour plot
Q2: for the asynchornous correlation (not sure yet what it is all about!) the Hilbert transform is mentioned. Can one use the built-in mcad fn hilbert()?
Thanks
Regards
Apr 02, 2016
11:30 AM
- Mark as New
- Bookmark
- Subscribe
- Mute
- Subscribe to RSS Feed
- Permalink
- Notify Moderator
Apr 02, 2016
11:30 AM
You can't do what is in the Wikipedia article with only two spectra. You need a sequence of spectra that vary, for example, over time. You can think of the synchronous contour plot as the correlation between the time varying response at frequency f1 with the time varying response at frequency f2, for all f1 and f2. The asynchronous contour plot is orthogonal to that. I have used this type of analysis in the past (in fact, I know it's inventor, Isao Noda), but not in Mathcad. Your plot looks very like one produced from this type of analysis, but beyond that I'm just guessing. Do you not have any more information about how the plot was created?
Apr 02, 2016
12:15 PM
- Mark as New
- Bookmark
- Subscribe
- Mute
- Subscribe to RSS Feed
- Permalink
- Notify Moderator
Apr 02, 2016
12:15 PM
Richard
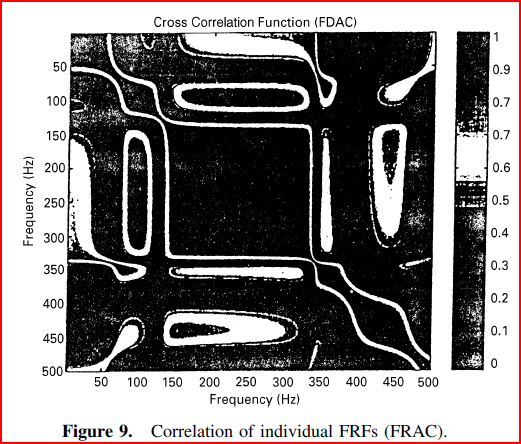
I have attached 2 papers showing this type of plot. Paper 1 pg 14 is the one I extracted the original picture from. It looks like it is based on the calculation of the FRAC value(s) (see equation just before the plot)
I am looking at vibration test data vs analytical prediction. I can obviously look at the frequencies at which some of the peaks occurs and do a comparison on that. But there are more "advance" technics out there so I am looking at them.
data wise: all I have are acceleration responses in the frequency domain. For the sake of this discussion I am assuming that they represent the H vectors required by the FRAC equation
Thanks
Regards

