
Turn on suggestions
Auto-suggest helps you quickly narrow down your search results by suggesting possible matches as you type.
Showing results for
Turn on suggestions
Auto-suggest helps you quickly narrow down your search results by suggesting possible matches as you type.
Showing results for
Community Tip - If community subscription notifications are filling up your inbox you can set up a daily digest and get all your notifications in a single email. X
Options
- Subscribe to RSS Feed
- Mark Topic as New
- Mark Topic as Read
- Float this Topic for Current User
- Bookmark
- Subscribe
- Mute
- Printer Friendly Page
Colour map for Contour plot ?
Apr 15, 2016
07:34 AM
- Mark as New
- Bookmark
- Subscribe
- Mute
- Subscribe to RSS Feed
- Permalink
- Notify Moderator
Apr 15, 2016
07:34 AM
Colour map for Contour plot ?
To all,
I have created a contour plot and trying to control the scale and/or the colour scheme.
Under the advanced properties I can see the option 'choose colormap'
Q1: with the (default) rainbow map, is red the high value or low value (on the z axis)? look high it's the high value
Q2: I believe (from the doc) one can allocate a colour map ( SaveColormap and LoadColormap functions)
Can this be used to create one own scale so that
[0-0.1] = a colour
]0.1-0.2] = another colour
...
]0.9-1] = red
a 10 band colour map
Thanks
Regards
Labels:
- Labels:
-
Other
3 REPLIES 3
Apr 15, 2016
07:55 AM
- Mark as New
- Bookmark
- Subscribe
- Mute
- Subscribe to RSS Feed
- Permalink
- Notify Moderator
Apr 15, 2016
07:55 AM
J B wrote:
To all,
I have created a contour plot and trying to control the scale and/or the colour scheme.
Under the advanced properties I can see the option 'choose colormap'
Q1: with the (default) rainbow map, is red the high value or low value (on the z axis)? look high it's the high value
Q2: I believe (from the doc) one can allocate a colour map ( SaveColormap and LoadColormap functions)
Can this be used to create one own scale so that
[0-0.1] = a colour
]0.1-0.2] = another colour
...
]0.9-1] = red
a 10 band colour map
Thanks
Regards
Does the attached help any?
You'll need to add the correct path for you Mathcad colormap folder.
Stuart
Apr 15, 2016
08:26 AM
- Mark as New
- Bookmark
- Subscribe
- Mute
- Subscribe to RSS Feed
- Permalink
- Notify Moderator
Apr 15, 2016
08:26 AM
thanks a lot Stuart. Will take me a while to go through the provided example/data
I suspect somewhere there is an example on how to set up a "fixed" 10 value colour band
Apr 15, 2016
09:04 AM
- Mark as New
- Bookmark
- Subscribe
- Mute
- Subscribe to RSS Feed
- Permalink
- Notify Moderator
Apr 15, 2016
09:04 AM
J B wrote:
thanks a lot Stuart. Will take me a while to go through the provided example/data
I suspect somewhere there is an example on how to set up a "fixed" 10 value colour band
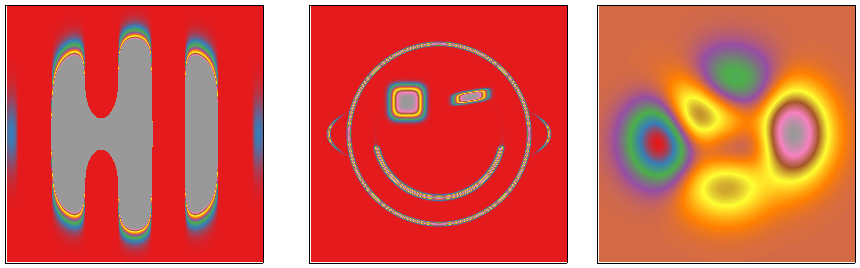
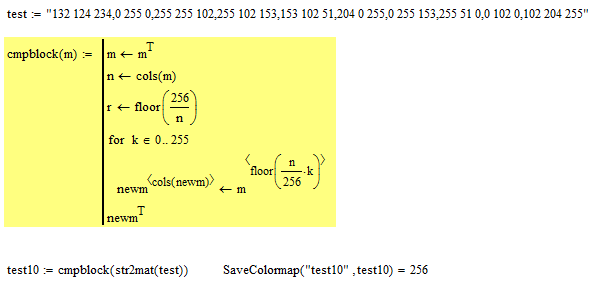
I don't think it does that ... the colour mapping interpolates, IIRC, so if there is no block banding of the colours (they smear together). However, here's a simple function that should help.
Just create a string of the RGB values of your chosen colours (I used a standard colour picker and chose some at random), convert it to a matrix (using my conversion routine str2mat), pass to the block colour mapping function below and then save as a colormap. (You could also just type the coefficients straight into a 10x3 matrix rather than do the conversion, but I find the string method easier)
The new colour map is the 3rd from the right in the map below.

Staurt

