
Turn on suggestions
Auto-suggest helps you quickly narrow down your search results by suggesting possible matches as you type.
Showing results for
Turn on suggestions
Auto-suggest helps you quickly narrow down your search results by suggesting possible matches as you type.
Showing results for
Community Tip - You can subscribe to a forum, label or individual post and receive email notifications when someone posts a new topic or reply. Learn more! X
Options
- Subscribe to RSS Feed
- Mark Topic as New
- Mark Topic as Read
- Float this Topic for Current User
- Bookmark
- Subscribe
- Mute
- Printer Friendly Page
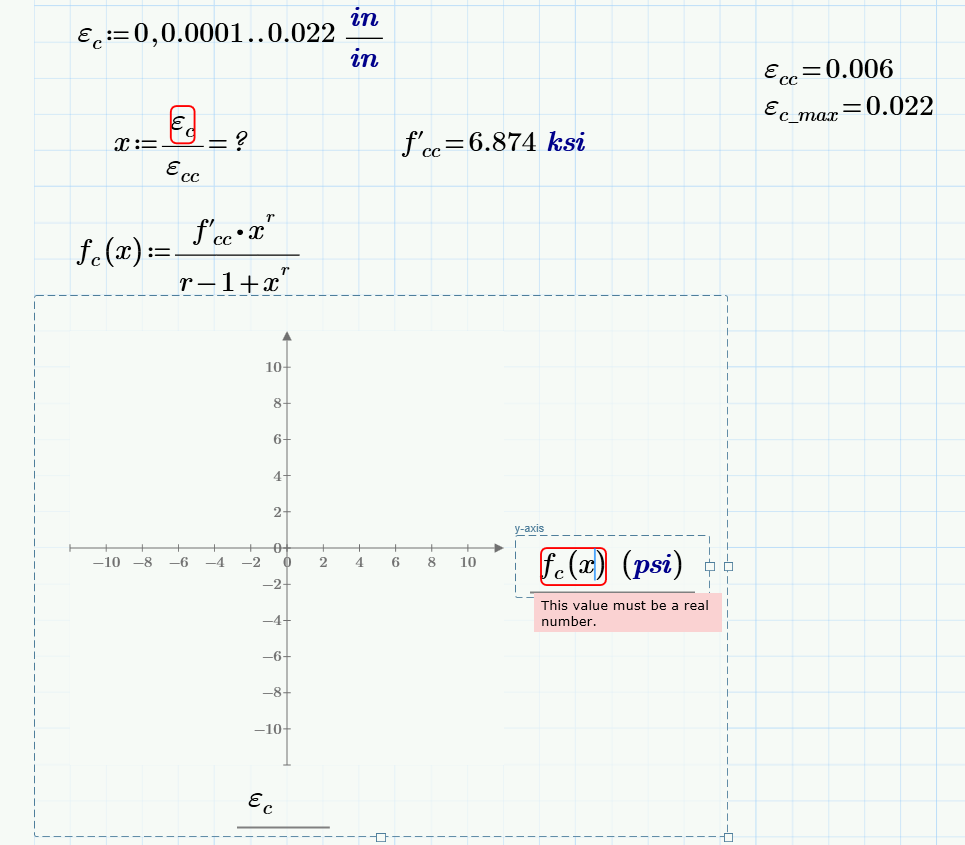
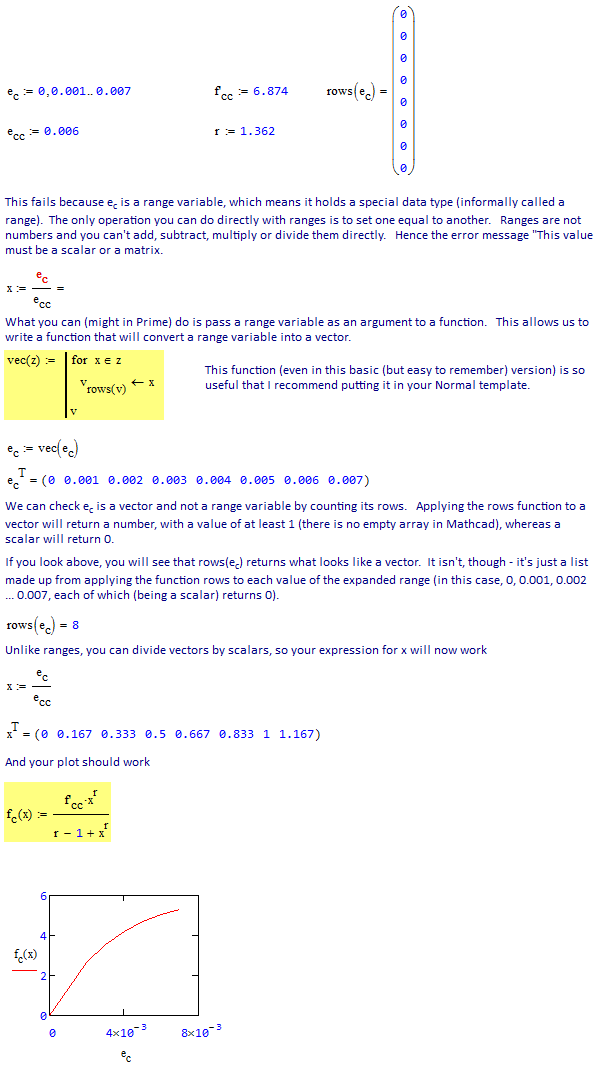
Error in plot: Value must be a real number error? why is that?
Sep 22, 2016
11:56 AM
- Mark as New
- Bookmark
- Subscribe
- Mute
- Subscribe to RSS Feed
- Permalink
- Notify Moderator
Sep 22, 2016
11:56 AM
Error in plot: Value must be a real number error? why is that?
Hi I do not understand why there is a issue with this simple plot with respect "value must be a real number". Any suggestions?
Labels:
- Labels:
-
Other
15 REPLIES 15
Sep 22, 2016
11:56 AM
- Mark as New
- Bookmark
- Subscribe
- Mute
- Subscribe to RSS Feed
- Permalink
- Notify Moderator
Sep 22, 2016
11:56 AM
Sep 22, 2016
11:58 AM
- Mark as New
- Bookmark
- Subscribe
- Mute
- Subscribe to RSS Feed
- Permalink
- Notify Moderator
Sep 22, 2016
11:58 AM
where 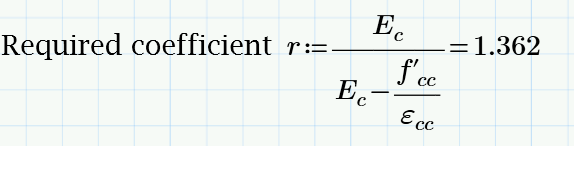
Sep 22, 2016
12:35 PM
- Mark as New
- Bookmark
- Subscribe
- Mute
- Subscribe to RSS Feed
- Permalink
- Notify Moderator
Sep 22, 2016
12:35 PM
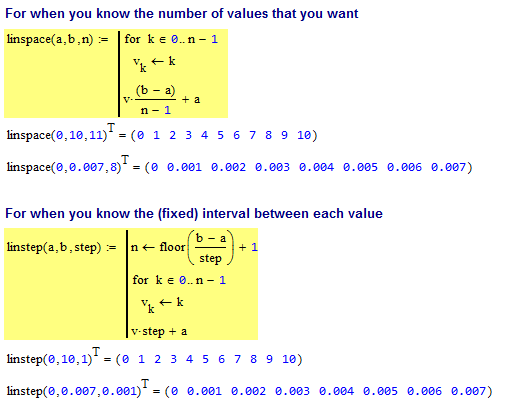
Another couple of functions that help out in situations like this are:
Stuart
Sep 22, 2016
03:07 PM
- Mark as New
- Bookmark
- Subscribe
- Mute
- Subscribe to RSS Feed
- Permalink
- Notify Moderator
Sep 22, 2016
03:07 PM
Here is another way to deal with the original problem:
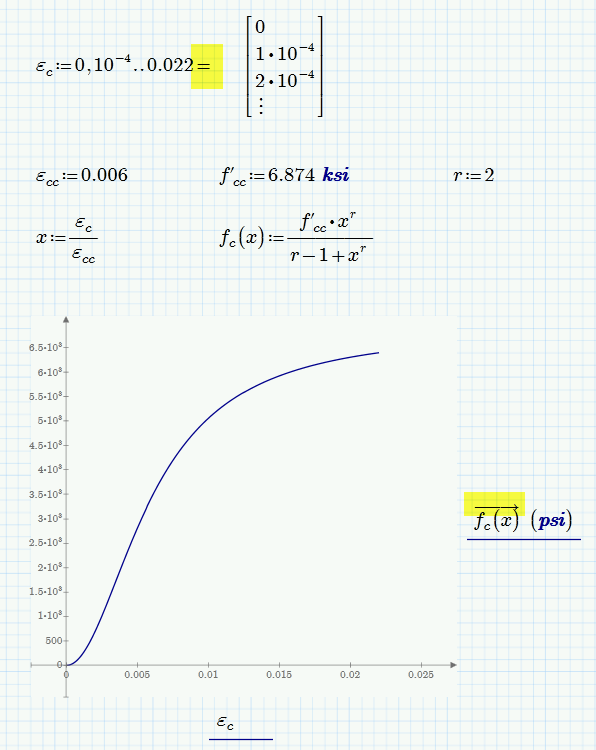
The inline evaluation turns epsilon.c into a vector and the vectorisation operator turn f.c(x) into a vector. So you plot one vector wrt the other.
Sep 22, 2016
11:12 PM
- Mark as New
- Bookmark
- Subscribe
- Mute
- Subscribe to RSS Feed
- Permalink
- Notify Moderator
Sep 22, 2016
11:12 PM
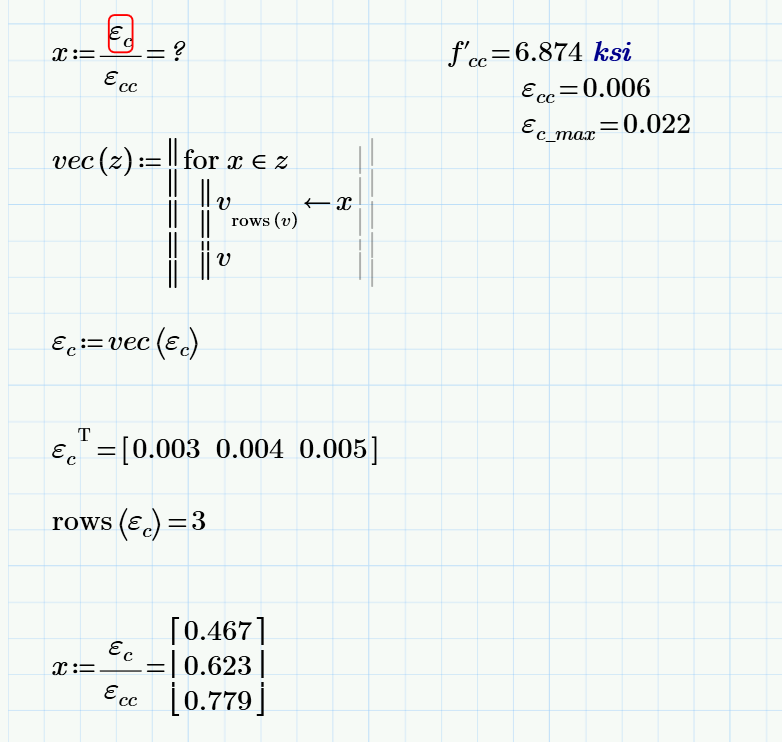
Yes this one worked too but not using an else if statement. Also I noticed that fc will still work without having to add a vector arrow in the plot itself as long as you just set ec = [ ].
Sep 22, 2016
12:20 PM
- Mark as New
- Bookmark
- Subscribe
- Mute
- Subscribe to RSS Feed
- Permalink
- Notify Moderator
Sep 22, 2016
12:20 PM
Juan Rodriguez wrote:
Hi I do not understand why there is a issue with this simple plot with respect "value must be a real number". Any suggestions?
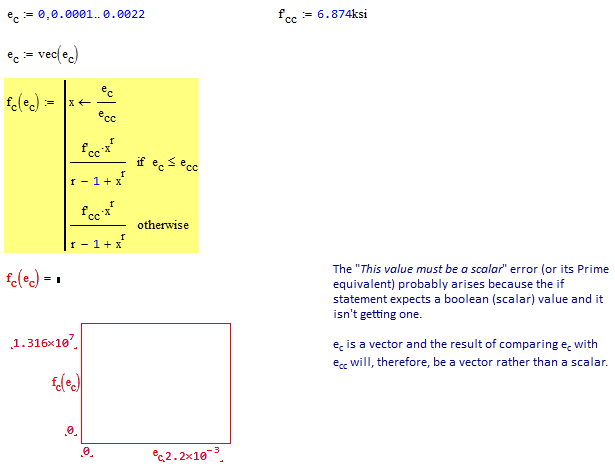
See the below Mathcad 15 explanation. You need to convert ec to a vector (rather than leaving it as a range variable).
Stuart
Sep 22, 2016
02:42 PM
- Mark as New
- Bookmark
- Subscribe
- Mute
- Subscribe to RSS Feed
- Permalink
- Notify Moderator
Sep 22, 2016
02:42 PM
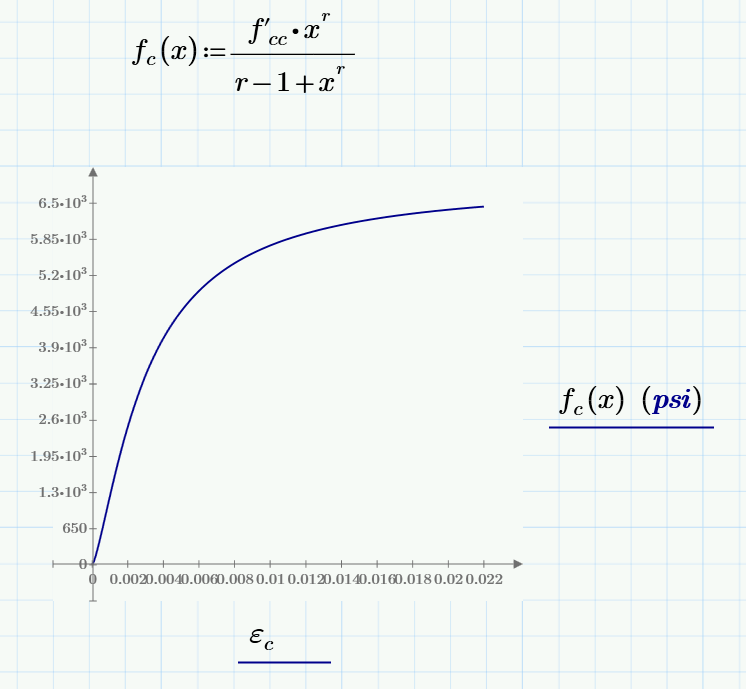
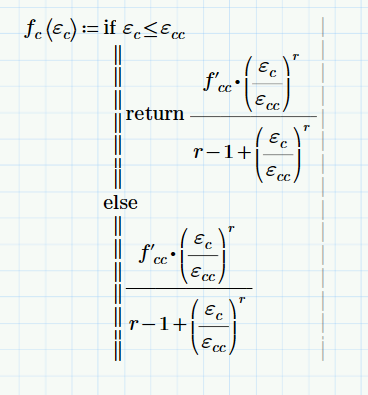
Thank you for your reply. I followed below the same steps in prime and worked. However I wanted to modify my function a little different and did not work again. How can you fix this one? why it did not work? I still have difficulty understanding this process. Thank you.
Sep 22, 2016
02:42 PM
- Mark as New
- Bookmark
- Subscribe
- Mute
- Subscribe to RSS Feed
- Permalink
- Notify Moderator
Sep 22, 2016
02:42 PM

Sep 22, 2016
02:44 PM
- Mark as New
- Bookmark
- Subscribe
- Mute
- Subscribe to RSS Feed
- Permalink
- Notify Moderator
Sep 22, 2016
02:44 PM
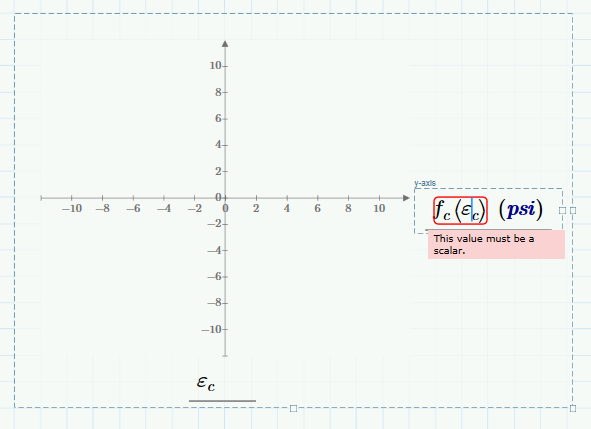
This last one did not work. again the message in the red box enclosing fc(x) says: "This value must be a scalar"
Sep 22, 2016
03:03 PM
- Mark as New
- Bookmark
- Subscribe
- Mute
- Subscribe to RSS Feed
- Permalink
- Notify Moderator
Sep 22, 2016
03:03 PM
how can you specify a limited range? the 2 other alternatives how do they work? Thank you
Sep 22, 2016
06:22 PM
- Mark as New
- Bookmark
- Subscribe
- Mute
- Subscribe to RSS Feed
- Permalink
- Notify Moderator
Sep 22, 2016
06:22 PM
Juan Rodriguez wrote:
how can you specify a limited range? the 2 other alternatives how do they work? Thank you
If you mean, use the if..elseif..else statements, then you do them the way you are doing (just make sure you're using the right variable in the comparisons).
The two alternatives work by first creating a vector of values from 0 to number_of_values, and then scaling it (by multiplying by the step size) and adding the start value.
eg,
linspace with a = 1, b = 2, n = 3
n gives a vector of 3 values [0,1,2] (starting at zero)
The difference is b - a = 1, which we divide by the number of gaps (n - 1 = 2) to get the average step size (1/2 = 0.5) giving a scaled vector = [0,1,2] * 0.5 = [0,0.5,1]
We then add on a to shift the vector to the starting point, giving a result of [0,0.5,1]+1 = [1,1.5,2]
linsteps works in a similar way, except that it has to calculate the number of steps first (but doesn't need to calculate the step size, as that's a given).
We could have defined them using a while loop instead of a for loop.
Stuart
Sep 22, 2016
06:10 PM
- Mark as New
- Bookmark
- Subscribe
- Mute
- Subscribe to RSS Feed
- Permalink
- Notify Moderator
Sep 22, 2016
06:10 PM
Juan Rodriguez wrote:
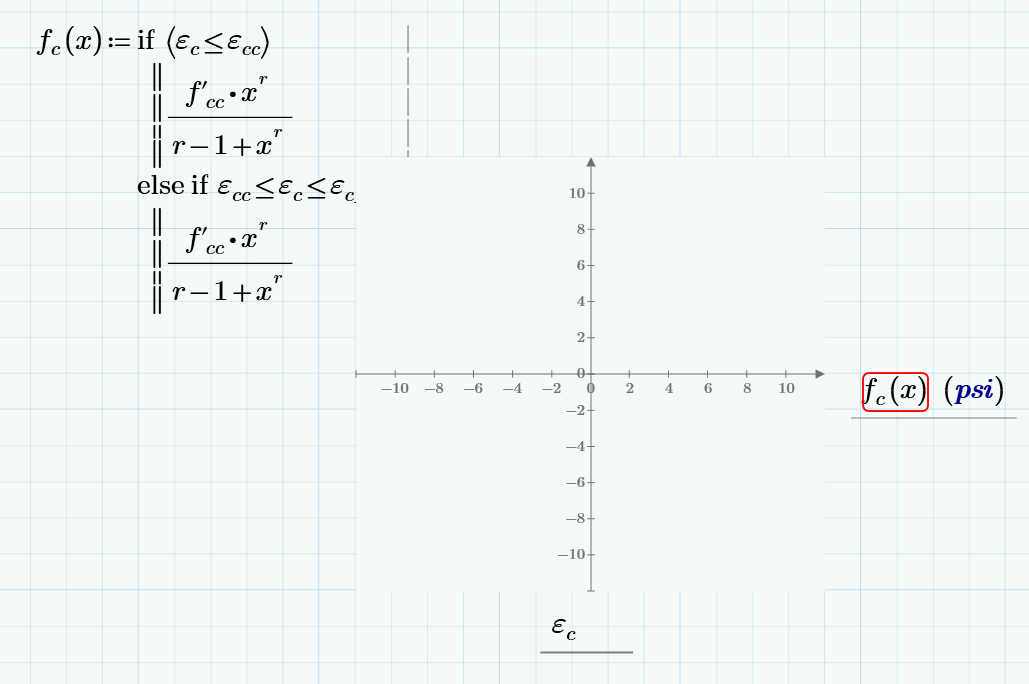
From the look of it, you've got a couple of problems (one of which I carried over in my original response). Let's deal with the latter first.
The independent variable on the plot is ec, but you are plotting fc( x). To fix this, you've got the option of:
- displaying x on the x-axis or
- modifying fc to calculate x internally and calling fc(ec) instead. (Just add a programming line at the start of your function setting x <- ec/ecc.
Changing fc to calculate x internally will also address your second problem, which is that fc is a function of x, but your comparisons use ec. I don't have Mathcad handy to check, but ec is a vector and, if I recall correctly, if you compare a vector with a scalar then you get a vector result (unless you do 😃 - in this case, the 'if' statement will raise an error as it expects to see a scalar not a vector.
Stuart
Sep 22, 2016
11:07 PM
- Mark as New
- Bookmark
- Subscribe
- Mute
- Subscribe to RSS Feed
- Permalink
- Notify Moderator
Sep 22, 2016
11:07 PM
Thank you. I changed to f(ec) vs ec but the error still the same. I vectorized e(c) at the beginning from a range of values to a vector. my comparisons however must be compared to scalar values. I think this is where the issue is. how do you convert a range of values to a "scalar" range of values (if there is such thing) so that the comparison can take place. I tried several attempts, even tried to vectorize ecc that is a scalar in comparison point but still did not work. I cant plot this. Am I missing something?
Sep 22, 2016
11:10 PM
- Mark as New
- Bookmark
- Subscribe
- Mute
- Subscribe to RSS Feed
- Permalink
- Notify Moderator
Sep 22, 2016
11:10 PM
Sep 23, 2016
05:32 AM
- Mark as New
- Bookmark
- Subscribe
- Mute
- Subscribe to RSS Feed
- Permalink
- Notify Moderator
Sep 23, 2016
05:32 AM
Hi Juan,
The problem arises because the plot passes the whole of ec to fc. This in turn means that ec<=ecc returns a vector, which causes the if statement to raise an error as its expecting a boolean (scalar).

Stuart

