
Turn on suggestions
Auto-suggest helps you quickly narrow down your search results by suggesting possible matches as you type.
Showing results for
Turn on suggestions
Auto-suggest helps you quickly narrow down your search results by suggesting possible matches as you type.
Showing results for
Community Tip - When posting, your subject should be specific and summarize your question. Here are some additional tips on asking a great question. X
Options
- Subscribe to RSS Feed
- Mark Topic as New
- Mark Topic as Read
- Float this Topic for Current User
- Bookmark
- Subscribe
- Mute
- Printer Friendly Page
Is there in mathcad a function that let us know the values and the frequency, when the mathcad "mode(A,B,...)" function returns the "multimodal" error?
Oct 26, 2016
03:51 AM
- Mark as New
- Bookmark
- Subscribe
- Mute
- Subscribe to RSS Feed
- Permalink
- Notify Moderator
Oct 26, 2016
03:51 AM
Is there in mathcad a function that let us know the values and the frequency, when the mathcad "mode(A,B,...)" function returns the "multimodal" error?
Hello everyone,
Does anyone know if mathcad provides a function that allows us to know what are the values that have the same frequency, and the frequency too, when the mathcad "mode(A,B,...)" function returns the "multimodal" error?
To be more clear, it is given the vector A, consisting of N elements with random values included within certain limits, I want a function that let me know what are the elements of A that have the same statistical frequency, and what is the statistical frequency, since the mathcad 15 function "mode(A)" returns "mutimodal error" if in the vector there are more than one value with the same statistical frequency.
Thank you
FM
Solved! Go to Solution.
Labels:
- Labels:
-
Other
1 ACCEPTED SOLUTION
Accepted Solutions
Oct 26, 2016
02:02 PM
- Mark as New
- Bookmark
- Subscribe
- Mute
- Subscribe to RSS Feed
- Permalink
- Notify Moderator
Oct 26, 2016
02:02 PM
I fear that the hist or histogram function does not help that much, unless you find an easy way to create a histogram where every data value has its own bin and the midpoints of the intervals are exactly the data values.
Otherwise you would have rely on a small user-written function. I guess the creation of the correct vector of interval endpoints for "histogram" would be the same work as writung a routine which outputs exactly what you demanded.
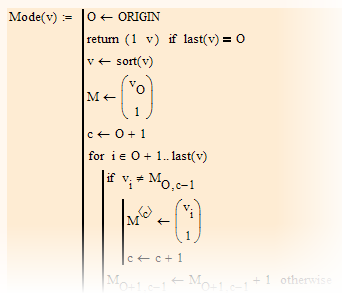
Heres a quick hack which sure could be done in a more elegant way:
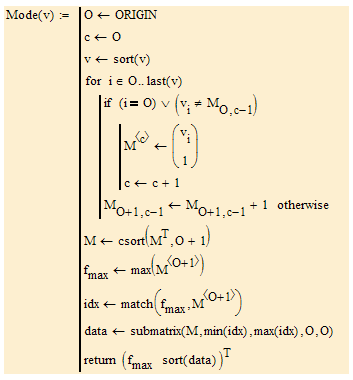
BTW, if you like to draw the histograms any way, I would suggest you use "histogram" instead of "hist" and use the first column of the output on the abscissa instead of the number of the bins.
11 REPLIES 11
Oct 26, 2016
07:19 AM
- Mark as New
- Bookmark
- Subscribe
- Mute
- Subscribe to RSS Feed
- Permalink
- Notify Moderator
Oct 26, 2016
07:19 AM
take a look at histogram
Oct 26, 2016
07:47 AM
- Mark as New
- Bookmark
- Subscribe
- Mute
- Subscribe to RSS Feed
- Permalink
- Notify Moderator
Oct 26, 2016
07:47 AM
Fred Kohlhepp написал(а):
take a look at histogram
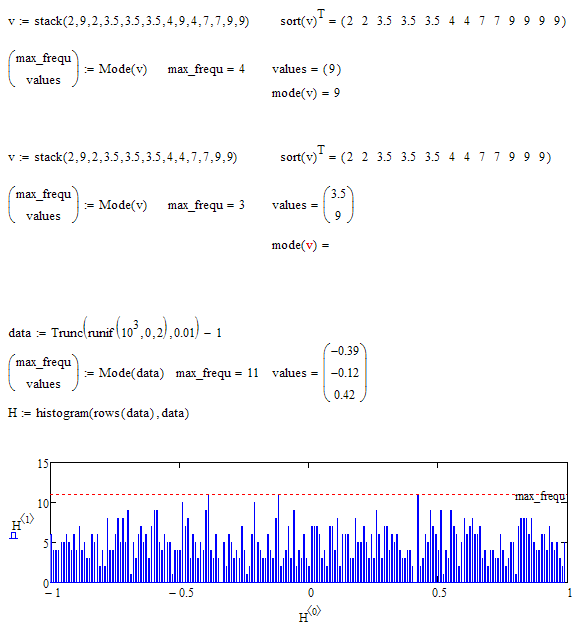
Like this
Oct 26, 2016
08:56 AM
- Mark as New
- Bookmark
- Subscribe
- Mute
- Subscribe to RSS Feed
- Permalink
- Notify Moderator
Oct 26, 2016
08:56 AM
Oct 26, 2016
02:02 PM
- Mark as New
- Bookmark
- Subscribe
- Mute
- Subscribe to RSS Feed
- Permalink
- Notify Moderator
Oct 26, 2016
02:02 PM
I fear that the hist or histogram function does not help that much, unless you find an easy way to create a histogram where every data value has its own bin and the midpoints of the intervals are exactly the data values.
Otherwise you would have rely on a small user-written function. I guess the creation of the correct vector of interval endpoints for "histogram" would be the same work as writung a routine which outputs exactly what you demanded.
Heres a quick hack which sure could be done in a more elegant way:
BTW, if you like to draw the histograms any way, I would suggest you use "histogram" instead of "hist" and use the first column of the output on the abscissa instead of the number of the bins.
Oct 27, 2016
02:13 AM
- Mark as New
- Bookmark
- Subscribe
- Mute
- Subscribe to RSS Feed
- Permalink
- Notify Moderator
Oct 27, 2016
02:13 AM
Thanks Werner,
I like this solution, although I was looking for an equivalent function provided by mathcad.
I am a bit puzzled by the argument of the if statement in the for loop: the column index of the matrix M starts by "O -1" which is negative, so the first element of the vector v is compared with something indefinite...
However, again many thanks
Greetings
FM
Oct 27, 2016
09:17 AM
- Mark as New
- Bookmark
- Subscribe
- Mute
- Subscribe to RSS Feed
- Permalink
- Notify Moderator
Oct 27, 2016
09:17 AM
I am a bit puzzled by the argument of the if statement in the for loop: the column index of the matrix M starts by "O -1" which is negative, so the first element of the vector v is compared with something indefinite...
O-1 is not necessarily negative, but it sure would be an invalid matrix index.
As I wrote its a quick hack and could/should be done better. I am relying on the fact, that Mathcad uses short-circuit evaluation for boolean expressions. That means that the second argument is executed or evaluated only if the first argument does not suffice to determine the value of the expression.
So if i=O is true (looking at the first vector element) the second expression (which looks at the previous vector element) needs not to be evaluated and therefore Mathcad don't even look at it. If it would be evaluated, we would get an error because of the invalid index. Its convenient but admittedly not really good programming style and could easily done without by assigning the first value outside of the loop. But now we have to additionally consider the case that the vector consists of one element only (second statement in program fragment below).
Oct 27, 2016
09:39 AM
- Mark as New
- Bookmark
- Subscribe
- Mute
- Subscribe to RSS Feed
- Permalink
- Notify Moderator
Oct 27, 2016
09:39 AM
The unmodified program produces a correct result, even in the case of a vector consisting of a single element while the modified one, reports an error.
Oct 27, 2016
10:13 AM
- Mark as New
- Bookmark
- Subscribe
- Mute
- Subscribe to RSS Feed
- Permalink
- Notify Moderator
Oct 27, 2016
10:13 AM
So the quick hack rules 😉
Possible reason for the error is that it should read: return (1 v)^T in the second line. Had not tested and forgot to transpose.
Oct 27, 2016
10:36 AM
- Mark as New
- Bookmark
- Subscribe
- Mute
- Subscribe to RSS Feed
- Permalink
- Notify Moderator
Oct 27, 2016
10:36 AM
Alles in ordnung!
Dankeschön
Oct 27, 2016
01:53 PM
- Mark as New
- Bookmark
- Subscribe
- Mute
- Subscribe to RSS Feed
- Permalink
- Notify Moderator
Oct 27, 2016
01:53 PM
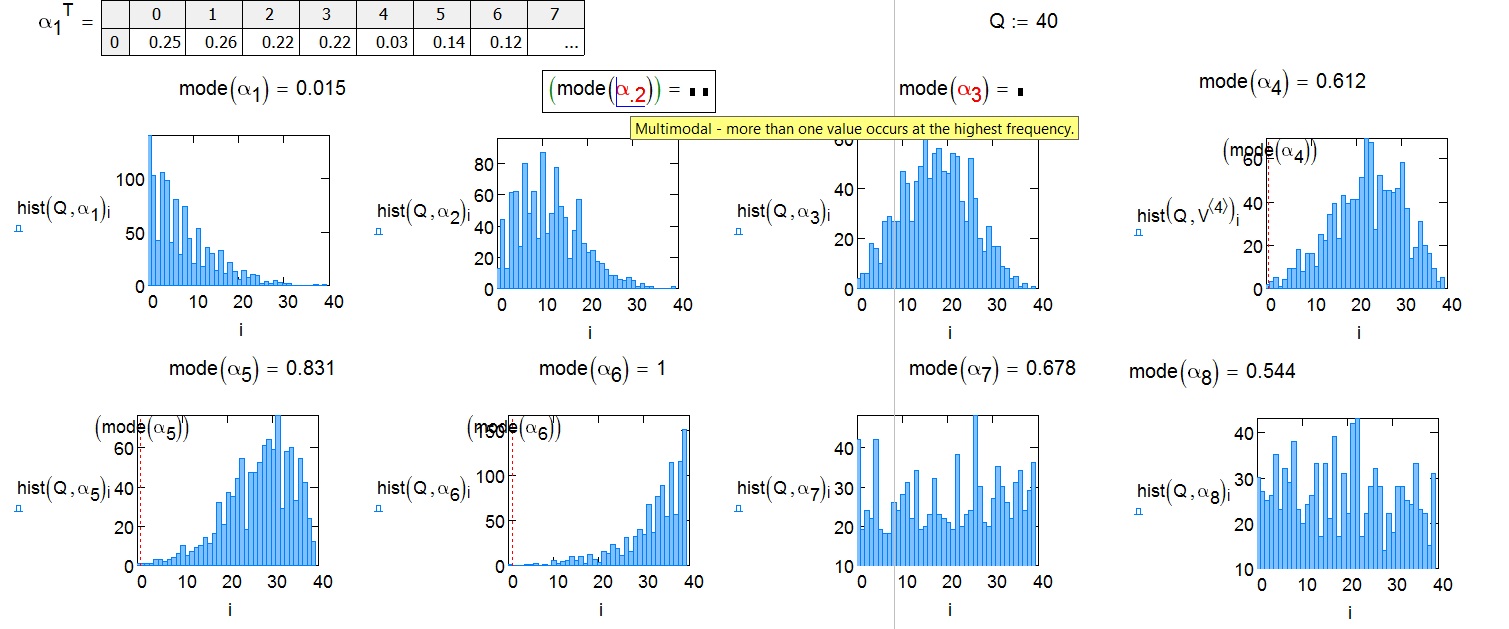
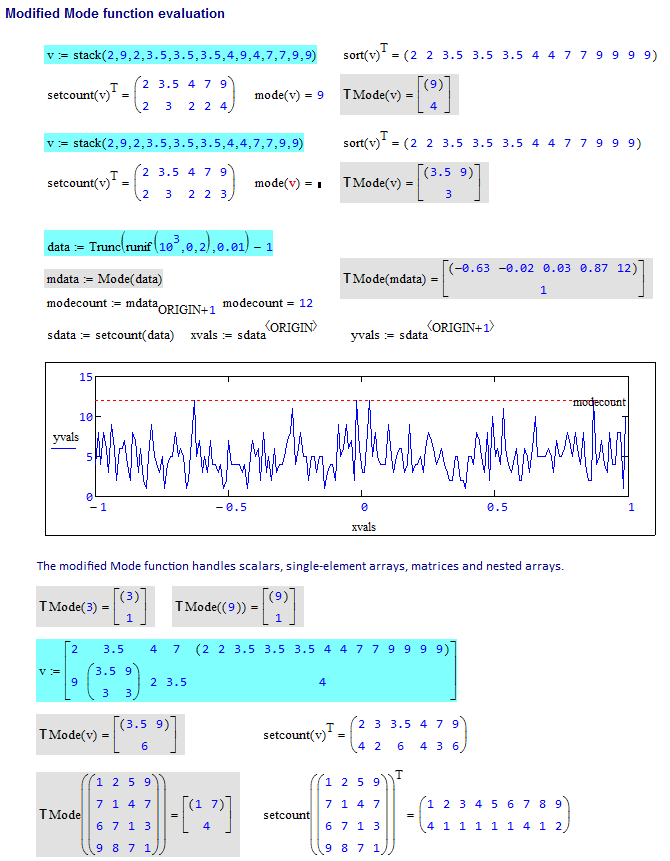
... a variant of your Mode function using my setcount function. Handles scalars, single-element arrays, vectors, matrices and arbitrarily-deeply nested arrays.
There is an ORIGIN-independent version in the attached worksheet.
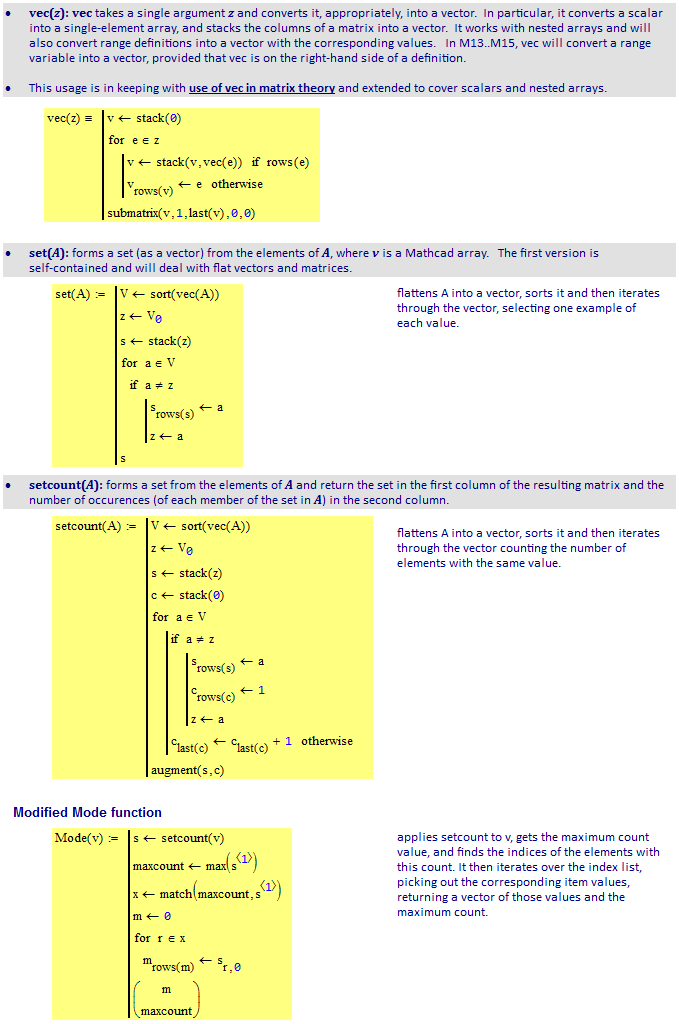
The function T (used in prefix mode) simply transposes any nested arrays in an array - useful for showing results in a more compact form (well, vertically at least!)
Stuart
Oct 27, 2016
03:00 PM
- Mark as New
- Bookmark
- Subscribe
- Mute
- Subscribe to RSS Feed
- Permalink
- Notify Moderator
Oct 27, 2016
03:00 PM
great utility - as usual!

