
Turn on suggestions
Auto-suggest helps you quickly narrow down your search results by suggesting possible matches as you type.
Showing results for
Turn on suggestions
Auto-suggest helps you quickly narrow down your search results by suggesting possible matches as you type.
Showing results for
Community Tip - Need to share some code when posting a question or reply? Make sure to use the "Insert code sample" menu option. Learn more! X
Options
- Subscribe to RSS Feed
- Mark Topic as New
- Mark Topic as Read
- Float this Topic for Current User
- Bookmark
- Subscribe
- Mute
- Printer Friendly Page
How to import a data Pspice on mathcad, to compare two curves
Feb 08, 2017
05:44 AM
- Mark as New
- Bookmark
- Subscribe
- Mute
- Subscribe to RSS Feed
- Permalink
- Notify Moderator
Feb 08, 2017
05:44 AM
How to import a data Pspice on mathcad, to compare two curves
Hello
Attached the mathcad program and pspice simulation
thank you
Labels:
- Labels:
-
Statistics_Analysis
6 REPLIES 6
Feb 08, 2017
06:23 AM
- Mark as New
- Bookmark
- Subscribe
- Mute
- Subscribe to RSS Feed
- Permalink
- Notify Moderator
Feb 08, 2017
06:23 AM
Your Pspice output data file is a binary file. While Mathcad can read that in, it requires a description of the fomat in order to interpret it correctly. And follwoing that some Mathcad programming to implement that interpretation.
It's easier to have Pspice output the result in an ASCII formatted file. I remember there was a setting in Pspice for the Probe data file format.
Alternatively you could use a .PRINT statement in your input deck, to output one or more node voltages to the Pspice output file.
Luc
Feb 08, 2017
06:34 AM
- Mark as New
- Bookmark
- Subscribe
- Mute
- Subscribe to RSS Feed
- Permalink
- Notify Moderator
Feb 08, 2017
06:34 AM
It would appear that PSpice is saving the data in a compressed format, so the file isn't human readable.
Depending on the result you require from the comparison, I can see 2 possibilities:
1. If you want to check the overall shape & scaling of the plot then I would use the aero functions of windows to drag the Mathcad to fill 1 half of the screen & the simulation plot the other.
2. if you need a more definitive mathematical comparison to show the errors at different frequencies then I think that you will need to investigate the options for exporting the data from PSpice to .csv or other data format to enable it to be read.
We use simplis / symetrix as a simulation platform; a command "show /file test1.dat :99" will export the voltage data for node 99 in the simulation.
Converting:
to :
time :99
0 6.471506880061777
4.0000000000000004e-011 6.471919765852963
8.0000000000000008e-011 6.4723326133142214
1.2e-010 6.4727454224391057
1.6000000000000002e-010 6.4731581932212494
2.0000000000000003e-010 6.4735709256542595
2.4e-010 6.4739836197318672
2.8000000000000002e-010 6.4743962754477922
2.8099647559814699e-010 6.4744065549917886
3.2000000000000003e-010 6.4748088927958456
3.6000000000000005e-010 6.4752214717698742
4.0000000000000007e-010 6.4756340123637592
4.4000000000000003e-010 6.4760465145714621
4.8e-010 6.476458978386936
5.2000000000000007e-010 6.4768714038042834
5.6000000000000003e-010 6.4772837908175136
6.000000000000001e-010 6.477696139420873
6.4000000000000006e-010 6.4781084496084267 ...
file truncated !
There are also options to export data to the clipboard from the graphical post-processor.
Regards
Andy
Feb 08, 2017
06:53 AM
- Mark as New
- Bookmark
- Subscribe
- Mute
- Subscribe to RSS Feed
- Permalink
- Notify Moderator
Feb 08, 2017
06:53 AM
I don't believe that there is a possibility to transfer data from PSPICE to Mathcad.
You could use the unit of measures in your analysis, as follows:
Feb 08, 2017
09:23 AM
- Mark as New
- Bookmark
- Subscribe
- Mute
- Subscribe to RSS Feed
- Permalink
- Notify Moderator
Feb 08, 2017
09:23 AM
"I don't believe that there is a possibility to transfer data from PSPICE to Mathcad."
Now there's a challenge. I'm rather convinced of the opposite.
Bens,
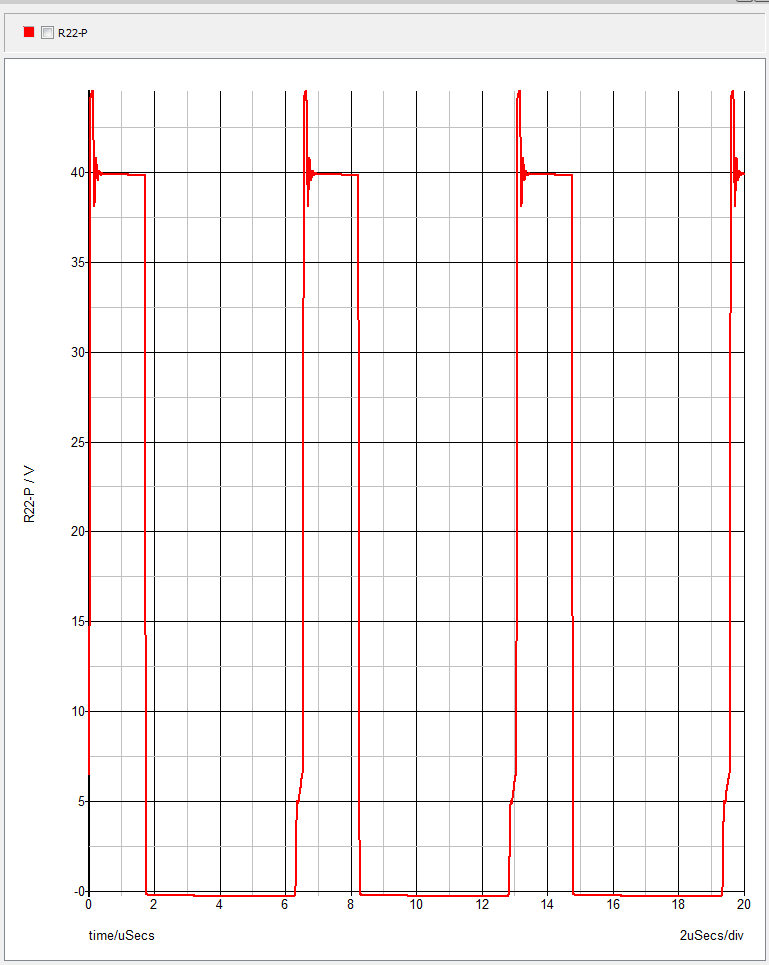
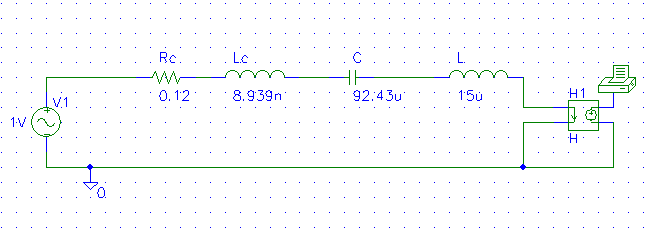
If you set up the schematic in Pspice, be sure to insert an H device (current to voltage converter) in series with your impedance.
Connect the lower output of the H device to ground, and to the upper output you connect a print symbol. This will allow to print the current flowing through your impedance.
Your schematic might look like:
Now run the simulation and afterwards check the Pspice output file. You'll find a table like this:
| FREQ | V($N_0006) |
1.000E+00 5.808E-04
1.047E+00 6.081E-04
1.096E+00 6.368E-04
....
9.550E+09 1.110E-06
1.000E+10 1.061E-06
Copy this table over to a new text file, just the data values! (forget about the FREQ and V(... line.
Now you can read it in with Mathcad.
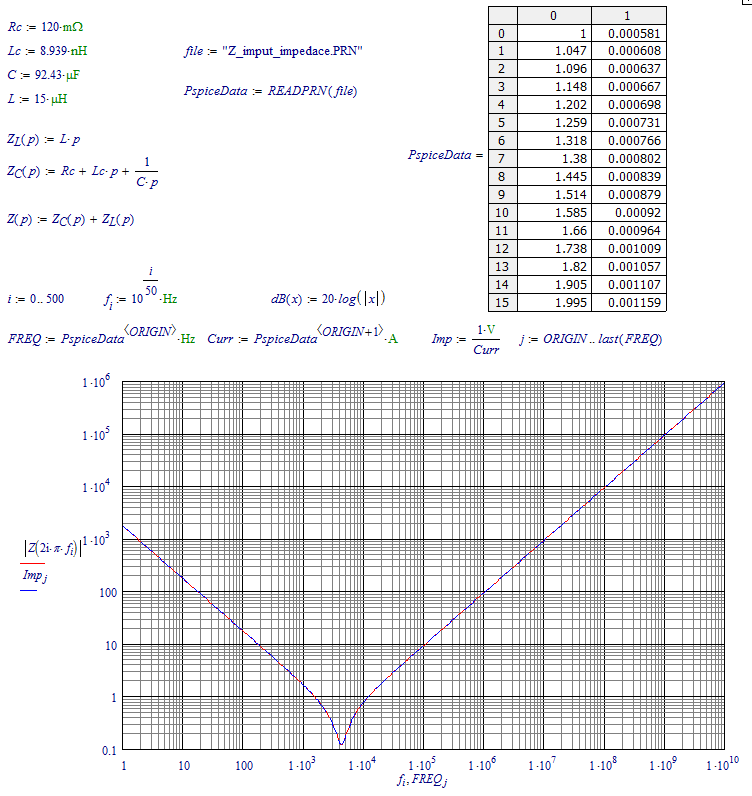
As you can see, the (solid) red line of the Mathcad model coincides with the (dashed) blue line of the Pspice output.
Success!
Luc
Feb 08, 2017
05:16 PM
- Mark as New
- Bookmark
- Subscribe
- Mute
- Subscribe to RSS Feed
- Permalink
- Notify Moderator
Feb 08, 2017
05:16 PM
hello
thank you very much
If you share the mathcad program will be more beneficial.
Greetings.
Feb 09, 2017
03:51 PM
- Mark as New
- Bookmark
- Subscribe
- Mute
- Subscribe to RSS Feed
- Permalink
- Notify Moderator

