
Turn on suggestions
Auto-suggest helps you quickly narrow down your search results by suggesting possible matches as you type.
Showing results for
Turn on suggestions
Auto-suggest helps you quickly narrow down your search results by suggesting possible matches as you type.
Showing results for
Community Tip - Your Friends List is a way to easily have access to the community members that you interact with the most! X
Options
- Subscribe to RSS Feed
- Mark Topic as New
- Mark Topic as Read
- Float this Topic for Current User
- Bookmark
- Subscribe
- Mute
- Printer Friendly Page
Can Prime 2.0 generate the Fourier Transform of a function centered about 0 in the time-domain?
May 17, 2017
01:15 AM
- Mark as New
- Bookmark
- Subscribe
- Mute
- Subscribe to RSS Feed
- Permalink
- Notify Moderator
May 17, 2017
01:15 AM
Can Prime 2.0 generate the Fourier Transform of a function centered about 0 in the time-domain?
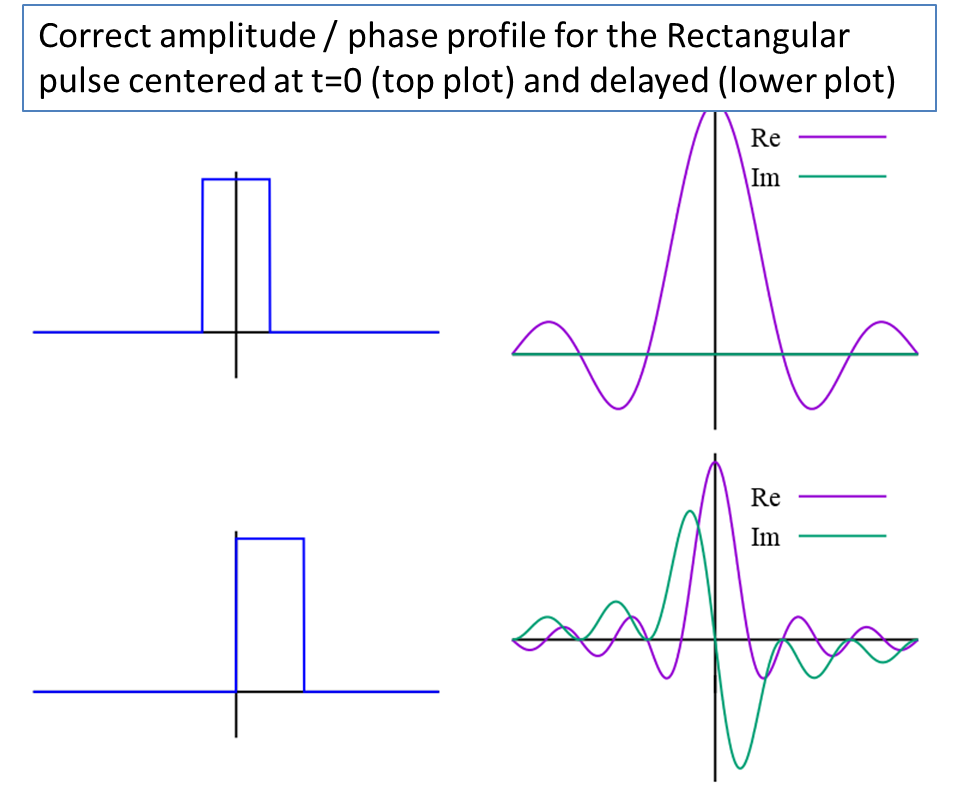
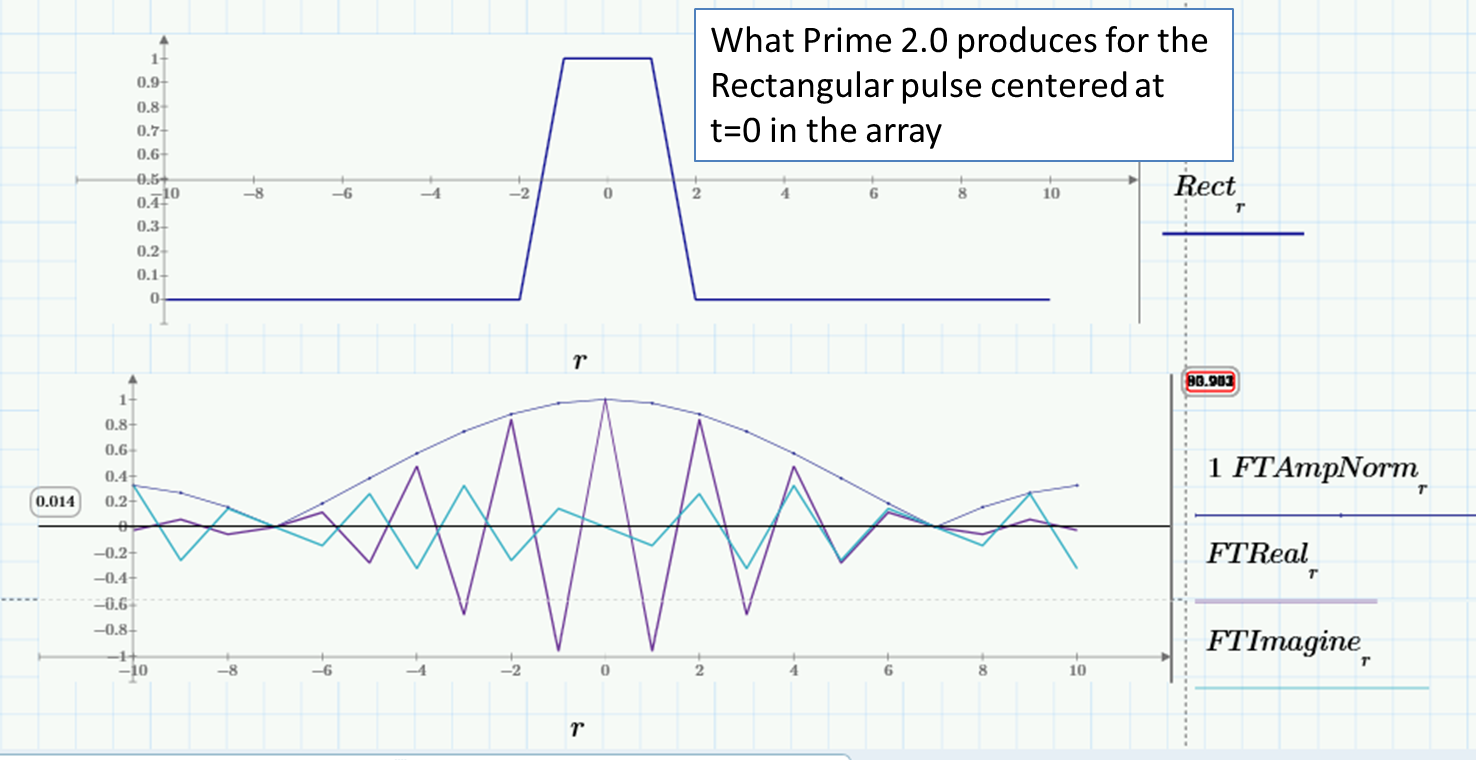
Using the .dft function in Prime 2.0, I cannot figure out how to get Mathcad to generate the Fourier transform (F.T.) of a function which is centered about the zero point (in the time domain). Regardless of the actual values of the indices used for the array which represents the time-domain function, Mathcad seems to interpret the first point in the array as being at time zero. So if I have a time-domain function that runs from t= -10 to t= +10, when Mathcad calculates the FT, it interprets the time domain function as running from t=0 to t=20. This gives the correct frequency amplitudes but it does not produce the correct phase profile. For example, if the time domain function is a rectangular pulse centered about t=0, the phase of all the constituent frequencies should be 0 (i.e. the F.T. is “real”). However, the .dft function produces a phase profile that corresponds to a rectangular pulse centered at t=100, which is a completely different phase profile.
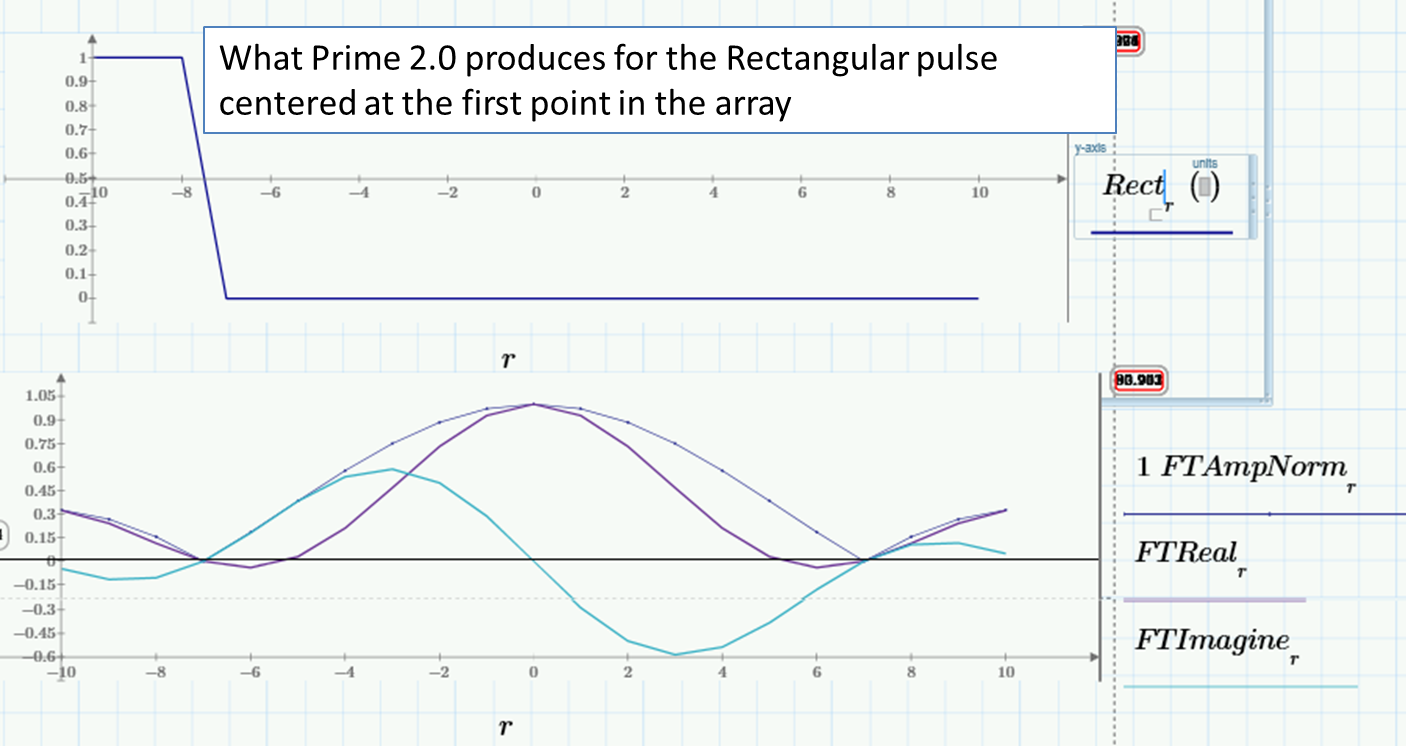
Moving the time domain function to the first point in the array does not solve the problem. Again the .dft function interprets the time-domain function as starting at t=0.
The images below show the correct amplitude and phase profiles for the rectangular pulse (from Wikipedia) along with what is produced by the .dft function. Does anyone know how to get the correct amplitude and phase profile for a function centered about t=0?
Labels:
- Labels:
-
Other
- Tags:
- fourier transforms
2 REPLIES 2
Jul 05, 2018
08:37 AM
- Mark as New
- Bookmark
- Subscribe
- Mute
- Subscribe to RSS Feed
- Permalink
- Notify Moderator
Jul 05, 2018
08:37 AM
It can, but you must put the input data points in a modified order. The DFT routines relate two sets of N numbers, which we can interpret as Fourier pairs of periodic, sampled functions. For a 21-point data set x0, x1, ...x20 (say for t= -10, -9, -8, ...8, 9, 10), the data represents a periodic waveform with values
...x19, x20, x0, x1 x2,..x9, x10, x11..,x19, x20, x0,x1...
Mathcad assumes that the first data value, x0, corresponds to t = 0, so that the assumed time values corresponding to the data vector with x0 as the first entry are:
Data: x0, x1 x2,..x9, x10, x11..,x19, x20
Assumed time: 0, 1 2,.. 9, 10, 11.., 19, 20
Since the data is periodic, we can fill in the assumed data values for earlier and later times:
Data: ... ,x18, x19, x20, x0, x1, x2,..x9, x10, x11..,x19, x20, x0, x1...
Assumed time: ... , -3 -2, -1, 0, 1, 2,.. 9, 10, 11.., 19, 20, 21, 22...
with a period of 21 in this case, the data value for t = -1 is the same as the data value for t = -1 +21 = 20. The data value for t = -10 is the same as the data value for t = -10 +21 = 11. To give the routine what it expects, the input vector needs to be wrapped so that the first value corresponds to t = 0, the second to t= 1, ... and with the last value corresponding to t= -1.
In the example, the correct order would be
x10 (which is assumed to be the t=0 point), x11, x12,...x20, x0, x1, x2, ...x9.
Summary: the first half of the input vector represents data from t=0 to the first half of the period, and the second half represents data over the half-period ending at (but not including) t=0.
A few additional comments. The same thing happens for the inverse transforms, e.g. going from frequency back to time. The frequency spectrum is also periodic, and the resulting discrete vector describe a single period. The assumed correspondence for the spectrum is that the first data point correspond to f = 0. To see the spectrum from -fs/2 to +fs/2, the spectrum output from the DFT must be wrapped appropriately, since it comes out as data over the range from 0 to fs.
Since neither time nor frequency is an input to the transforms, only the size N of the data is known to the routine. any associations of data points to actual time or frequency vectors must be handled separately. One could make routines that do this, say take a time vector and data vector as inputs, and do the neccesary wraps and scalings to give zero-centered frequency and spectrum outputs. (I must admit that I never did this myself).
Lastly, pay attention to the vector sizes and time scalings. In the example, given, the period is 21, not 20, The data is specified over a range t= -10 to +10. The next data point, for t = 11, would be assumed to be the first repaet value = x(t= -10). with 21 points in the period and a sample time = 1 sec, the spacing of the frequency points will be 1/21 Hz, and not 1/20 Hz as may have been expected.
Disclaimer: most of my (now infrequent) work is with old version 11; still my favorite.
Lou
Jul 07, 2018
05:56 AM
- Mark as New
- Bookmark
- Subscribe
- Mute
- Subscribe to RSS Feed
- Permalink
- Notify Moderator
Jul 07, 2018
05:56 AM
Hi,
I used MC15 getting this result ....... I'm sorry are missing the comments ......


