
Turn on suggestions
Auto-suggest helps you quickly narrow down your search results by suggesting possible matches as you type.
Showing results for
Turn on suggestions
Auto-suggest helps you quickly narrow down your search results by suggesting possible matches as you type.
Showing results for
Community Tip - If community subscription notifications are filling up your inbox you can set up a daily digest and get all your notifications in a single email. X
Options
- Subscribe to RSS Feed
- Mark Topic as New
- Mark Topic as Read
- Float this Topic for Current User
- Bookmark
- Subscribe
- Mute
- Printer Friendly Page
How to interpret the returned vector of loess(vx,vy,span)
Mar 09, 2012
01:23 PM
- Mark as New
- Bookmark
- Subscribe
- Mute
- Subscribe to RSS Feed
- Permalink
- Notify Moderator
Mar 09, 2012
01:23 PM
How to interpret the returned vector of loess(vx,vy,span)
Hello everyone,
I am using "loess" function to generate a regression curve for my experimental data. I understand that loess(vx,vy,span) returns a vector that includes the smoothed coordinates of vy and information of a set of 2nd order polynomials. I know I can use interp(vs,vx,vy,x) to get the interpolated y-value corresponding to x using the output vector vs from loess. However, I want to know the meaning of the values in the vector returned by loess, so that I can utilize the regression curve generated by loess in my own program for subsequent calculations. In other words, I want to reproduce the smoothed curve generated by loess without using interp function. Here is an example, suppose
vx=[0, 10, 15, 20],
and vy=[0, 227.04, 362.78, 517.35],
loess(vx, vy, 2) will then give,
loess(vx, vy, 2)=[1, 52, 0.067, 226.546, 363.622, 517.047, -0.067, 0.494, -0.842, 0.303, 1, 4, 2, 7, 5, 1.049e3, 849, 1, 1, 1, 0, 0, 0, 0, 10, 0, 15, 0, 0, 0, 0, -0.1, 20.1, -1.877, 19.412, 520.281, 32.372, 226.546, 25.807, 0.067, 19.475, 363.622, 29.064, 1, 1, 1, 1, 1, 1.251, 0.67, 0.455, 2].
So far, what I've figured out is that, the first element, 1, of the returned vector, indicates that it was loess that had been used; the 2nd element, 52, indicates that there is a total of 52 elements in this vector; the last element, 2, is the value of 'span' used in loess; the 3rd to 6th elements are the smoothed coordinates (or knodes on the smoothed curve) of vy; and the 7th to 10th elements are the difference between the original vy and the smoothed vy (3rd element to 6th elements in this case). MathCAD's manual mentioned that loess(vx,vy,span) uses a set of 2nd polynomials that best fit the neighborhood of x and y data values in vx and vy. So, I believe the rest elements in the returned loess vector must be information of these 2nd polynomials, but I just couldn't figured out what and where exactly are they. My question is basically how interp(vs,vx,vy,x) interprets the vs vector produced by loess. Thank you.
Labels:
- Labels:
-
Statistics_Analysis
10 REPLIES 10
Mar 09, 2012
02:32 PM
- Mark as New
- Bookmark
- Subscribe
- Mute
- Subscribe to RSS Feed
- Permalink
- Notify Moderator
Mar 09, 2012
02:32 PM
I believe (from what I've read reinforced by what you've written) that loes is a close relatiive of the spline functions--that it fits a sequence of 2nd order polynomials through the data rather than one smooth curve. The difference between the spline functions and loes is that loes constrains (via span) how many curves it uses, so it does not have to precisely match every point. (The spline functions match each point, and use as many segments as needed to do so.
For data fitting (generally) I/we/you would like one smooth curve, preferrably one with some physical rationale if we are measuring some physical event. Mathcad has a number of those functions, each will determine a set of coefficients for its' particular function that best fit the data supplied. If a polynomial fit will do, I suggest that you look at the regress function, which allows you to choose the order of your polynomial. While regress creates a vs vector and uses interp, it is fairly easy to deduce the basic polynomial from the vector.
If you have a function in mind that doesn't have a built-in fitting function, Genfit will allow you to develop the least squares fit to your own function (with work.)
There are also programs available that will fit a host of functions and summarize and order the best fits; try a web search for "curve expert".
Mar 09, 2012
05:58 PM
- Mark as New
- Bookmark
- Subscribe
- Mute
- Subscribe to RSS Feed
- Permalink
- Notify Moderator
Mar 09, 2012
05:58 PM
Here's what the good old Mathcad Treasury has to say on the subject.
To summarize: you don't want to know what the output is 
Mar 09, 2012
06:43 PM
- Mark as New
- Bookmark
- Subscribe
- Mute
- Subscribe to RSS Feed
- Permalink
- Notify Moderator
Mar 09, 2012
06:43 PM
Thanks, RJ. I understand that in most cases, you may not care about what the output of loess is. However, since I need to use the output of loess in my own program, I DO need to understand what the output is in this case. The file you posted is helpful and it mentioned that there were more infomation in the next section about how loess works. Do you happen to have the next section? Thank you.
Mar 09, 2012
06:55 PM
- Mark as New
- Bookmark
- Subscribe
- Mute
- Subscribe to RSS Feed
- Permalink
- Notify Moderator
Mar 09, 2012
06:55 PM
Thanks, RJ. I understand that in most cases, you may not care about what the output of loess is. However, since I need to use the output of loess in my own program, I DO need to understand what the output is in this case.
Perhaps, but the Treasury is usually very informative, so when it says you don't need to know, what it probably means is that half of the algorithm is in loess, and the other half is in interp. So, since you don't know what interp does, the output of loess really is useless to you.
Do you happen to have the next section?
Sure. I have all the sections 
It doesn't give you the answer though.
Nov 27, 2014
11:12 AM
- Mark as New
- Bookmark
- Subscribe
- Mute
- Subscribe to RSS Feed
- Permalink
- Notify Moderator
Nov 27, 2014
11:12 AM
Can you put it on Prime 3.0 version?
Nov 27, 2014
12:49 PM
- Mark as New
- Bookmark
- Subscribe
- Mute
- Subscribe to RSS Feed
- Permalink
- Notify Moderator
Nov 27, 2014
12:49 PM
Sorry, your question is not clear. What do you want in Prime 3.0?
Nov 27, 2014
12:59 PM
- Mark as New
- Bookmark
- Subscribe
- Mute
- Subscribe to RSS Feed
- Permalink
- Notify Moderator
Nov 27, 2014
12:59 PM
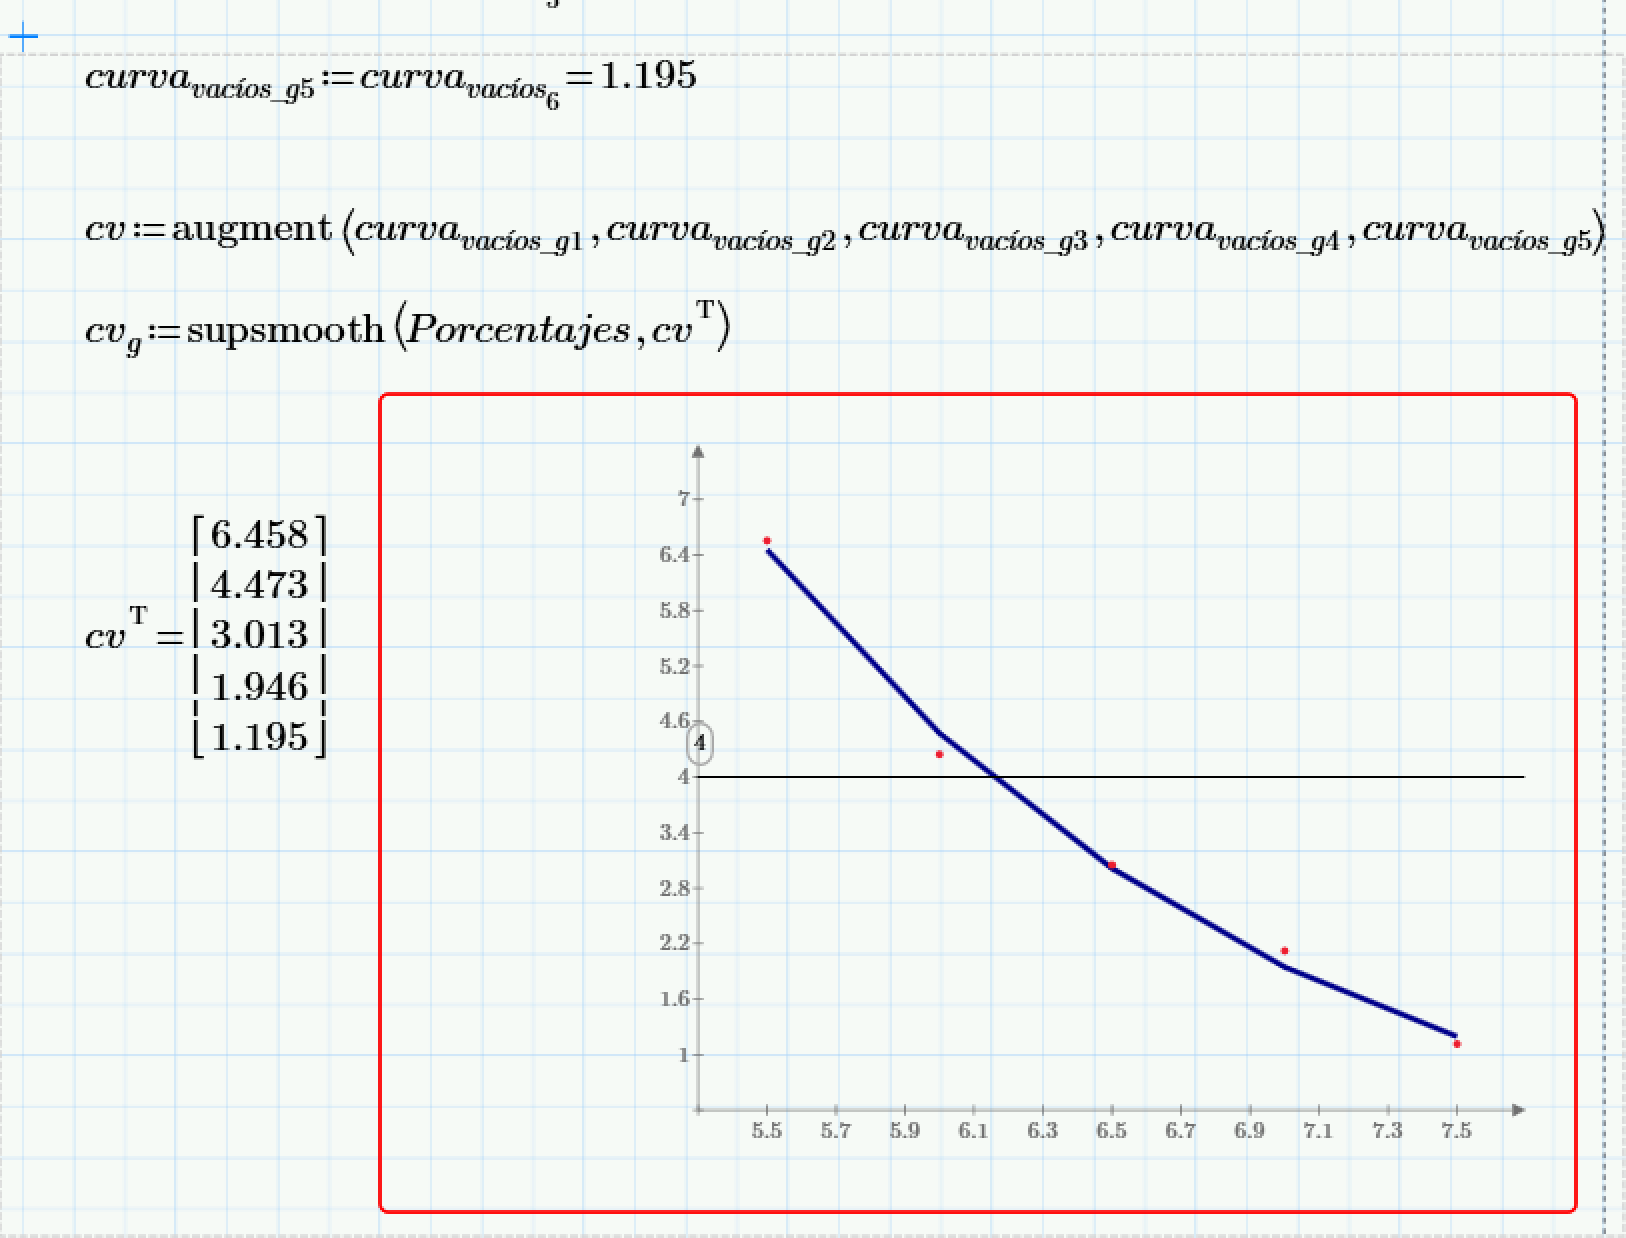
I have one big trouble, i'm making a Marshall Hot mix asphalt sheet, and in the end, i need to do some plots of the results, like (Porcentajes, Vacíos) and intercept the result in 4% and the result intercept in the other variables like VAM, Densidad, Flujo, etc.
In excel you make a tendence line with a ecuation, and i love mathcad and i need to prove to other team mates that work with Mathcad i better than excel.
Can you help me?
El mensaje fue editado por: Cristóbal Vélez Valdiviezo
Dec 02, 2014
02:44 PM
- Mark as New
- Bookmark
- Subscribe
- Mute
- Subscribe to RSS Feed
- Permalink
- Notify Moderator
Dec 02, 2014
02:44 PM
Look up "regression" (I guess, regresión in Spanish) in the help. See the attached file for examples.
To attach a file to a post click on "Use Advanced Editor" in the top right corner of the edit box when you are posting. No need for Dropbox.
Dec 02, 2014
03:21 PM
- Mark as New
- Bookmark
- Subscribe
- Mute
- Subscribe to RSS Feed
- Permalink
- Notify Moderator
Dec 02, 2014
03:21 PM
Thank you very much. I will try to do my best with your help.
Dec 02, 2014
04:54 PM
- Mark as New
- Bookmark
- Subscribe
- Mute
- Subscribe to RSS Feed
- Permalink
- Notify Moderator
Dec 02, 2014
04:54 PM
So you need the inverse of Vacios(Porcentajes) and thought you need to know more about the output of loess?
All you need is a simple solve block.
Find attached some variants using simple linear interpolation, spline interpolation and polynomial regression. The concept may be applied to any of th fit functions, too, if you find that more appropriate.

