
Turn on suggestions
Auto-suggest helps you quickly narrow down your search results by suggesting possible matches as you type.
Showing results for
Turn on suggestions
Auto-suggest helps you quickly narrow down your search results by suggesting possible matches as you type.
Showing results for
Community Tip - Your Friends List is a way to easily have access to the community members that you interact with the most! X
Options
- Subscribe to RSS Feed
- Mark Topic as New
- Mark Topic as Read
- Float this Topic for Current User
- Bookmark
- Subscribe
- Mute
- Printer Friendly Page
Horizontal axis in terms of pi
Feb 11, 2014
10:53 AM
- Mark as New
- Bookmark
- Subscribe
- Mute
- Subscribe to RSS Feed
- Permalink
- Notify Moderator
Feb 11, 2014
10:53 AM
Horizontal axis in terms of pi
Hello all..
When creating a 2D plot, is there a way to have the plot show the horizontal axis ticks in terms of pi rather than real numbers?
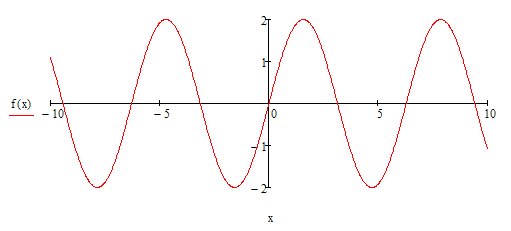
Here's a simple plot of f(x) = 2sin(4x)
The horizontal axis shows -10, -5, 0, 5, 10
I would like to add more ticks to this, but more importantly I would like them to be in tems of pi.
I looked through some of the previous posts, and MC 15 help, but I haven't found anything pertinent.
Any ideas?
Thanks
Solved! Go to Solution.
1 ACCEPTED SOLUTION
Accepted Solutions
Feb 11, 2014
11:23 AM
- Mark as New
- Bookmark
- Subscribe
- Mute
- Subscribe to RSS Feed
- Permalink
- Notify Moderator
Feb 11, 2014
11:23 AM
When creating a 2D plot, is there a way to have the plot show the horizontal axis ticks in terms of pi rather than real numbers?
Unfortunately - no. Thats another rather old, long standing but unheard user request.
9 REPLIES 9
Feb 11, 2014
11:04 AM
- Mark as New
- Bookmark
- Subscribe
- Mute
- Subscribe to RSS Feed
- Permalink
- Notify Moderator
Feb 11, 2014
11:27 AM
- Mark as New
- Bookmark
- Subscribe
- Mute
- Subscribe to RSS Feed
- Permalink
- Notify Moderator
Feb 11, 2014
11:27 AM
Thanks for the file and the quick response, but the x-axis on your plot consists of real numbers, not in terms of pi.
Feb 11, 2014
11:23 AM
- Mark as New
- Bookmark
- Subscribe
- Mute
- Subscribe to RSS Feed
- Permalink
- Notify Moderator
Feb 11, 2014
11:23 AM
When creating a 2D plot, is there a way to have the plot show the horizontal axis ticks in terms of pi rather than real numbers?
Unfortunately - no. Thats another rather old, long standing but unheard user request.
Feb 11, 2014
11:26 AM
- Mark as New
- Bookmark
- Subscribe
- Mute
- Subscribe to RSS Feed
- Permalink
- Notify Moderator
Feb 11, 2014
11:26 AM
Werner....
Seriously?!
Feb 11, 2014
11:33 AM
- Mark as New
- Bookmark
- Subscribe
- Mute
- Subscribe to RSS Feed
- Permalink
- Notify Moderator
Feb 11, 2014
11:33 AM
Thomas Hartman wrote:
Werner....
Seriously?!
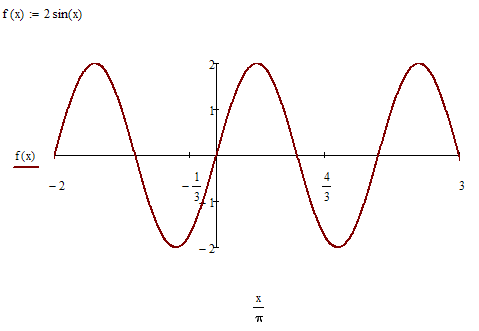
As long as you want integer or inter fraction multiples of pi displayed - yes. If you are happy with decimals representing multiples of pi you may try what David suggested.
The best I can come up with is this (and the x-axis labelling is abit confusiong because of the missing pi)
Feb 11, 2014
11:36 AM
- Mark as New
- Bookmark
- Subscribe
- Mute
- Subscribe to RSS Feed
- Permalink
- Notify Moderator
Feb 11, 2014
11:36 AM
Thank you......I could just copy the plot and then past in the values, but I was just flabbergasted this couldn't be done in mathcad.
Thanks Werner
Feb 11, 2014
11:42 AM
- Mark as New
- Bookmark
- Subscribe
- Mute
- Subscribe to RSS Feed
- Permalink
- Notify Moderator
Feb 11, 2014
11:42 AM
Its indeed often surprising how apparently simply features are missing in otherwise high end software products.
Feb 12, 2014
01:23 AM
- Mark as New
- Bookmark
- Subscribe
- Mute
- Subscribe to RSS Feed
- Permalink
- Notify Moderator
Feb 12, 2014
01:23 AM
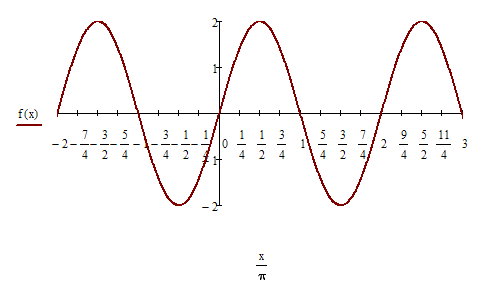
The result is just like all plots with units, and here pi is a unit. For plots with x as a distance in ft, for example, we don't see "ft" at each tick mark. Instead, we see numbers in the selected unit. We select the unit by dividing x by the unit, just as you have done with pi.
To show the units, create a label for the x axis, such as "angle in pi"
Feb 12, 2014
06:15 AM
- Mark as New
- Bookmark
- Subscribe
- Mute
- Subscribe to RSS Feed
- Permalink
- Notify Moderator
Feb 12, 2014
06:15 AM
The result is just like all plots with units, and here pi is a unit.
Yes I know and using pi as a unit here is just a weak workaround to get closer to what Thomas had originally requested (and a lot of simple plot programs do offer).
I also tried it in Prime - here you can put the pi in the unit placeholder of the axis label, but you have to define pi:=pi before, labelling the lefthand pi as unit.
Wish Mathcad would be able to label in multiple/fractions of pi without having to resort to this trick.

