
Turn on suggestions
Auto-suggest helps you quickly narrow down your search results by suggesting possible matches as you type.
Showing results for
Turn on suggestions
Auto-suggest helps you quickly narrow down your search results by suggesting possible matches as you type.
Showing results for
Community Tip - Your Friends List is a way to easily have access to the community members that you interact with the most! X
Options
- Subscribe to RSS Feed
- Mark Topic as New
- Mark Topic as Read
- Float this Topic for Current User
- Bookmark
- Subscribe
- Mute
- Printer Friendly Page
CSPLINE and iteration
Feb 19, 2014
12:57 PM
- Mark as New
- Bookmark
- Subscribe
- Mute
- Subscribe to RSS Feed
- Permalink
- Notify Moderator
Feb 19, 2014
12:57 PM
CSPLINE and iteration
to all
I am looking at some programme which will involve curve fitting (possibly). I had a look at the doc and it seems quite straigforward but I am not getting what I expect when attempting a plot of the cspline. The overall problem is explained in the attached mcad (can't copy and-paste)
Thanks
Regards
JXB
Labels:
- Labels:
-
Statistics_Analysis
13 REPLIES 13
Feb 19, 2014
01:37 PM
- Mark as New
- Bookmark
- Subscribe
- Mute
- Subscribe to RSS Feed
- Permalink
- Notify Moderator
Feb 19, 2014
01:37 PM
The attached file should help with cspline and linterp
Feb 20, 2014
04:27 AM
- Mark as New
- Bookmark
- Subscribe
- Mute
- Subscribe to RSS Feed
- Permalink
- Notify Moderator
Feb 20, 2014
04:27 AM
thanks Werner. Make sense now!
How does one interpolate between 2 sets of known data then? For example (see also attached) if one has data for a ratio b/d=0.1 and b/d=0.2 but one wants a Y value (K on the mcad sheet) for say b/d=0.164? Should one construct a "dummy" curve (spline) between thw 2 sets of data
Feb 20, 2014
04:49 AM
- Mark as New
- Bookmark
- Subscribe
- Mute
- Subscribe to RSS Feed
- Permalink
- Notify Moderator
Feb 20, 2014
04:49 AM
J B wrote:
thanks Werner. Make sense now!
How does one interpolate between 2 sets of known data then? For example (see also attached) if one has data for a ratio b/d=0.1 and b/d=0.2 but one wants a Y value (K on the mcad sheet) for say b/d=0.164? Should one construct a "dummy" curve (spline) between thw 2 sets of data
basically - yes. You are asking for a 2-dimensional interplolation. Guess the attached sheet should help.
Feb 20, 2014
04:33 AM
- Mark as New
- Bookmark
- Subscribe
- Mute
- Subscribe to RSS Feed
- Permalink
- Notify Moderator
Feb 20, 2014
05:05 AM
- Mark as New
- Bookmark
- Subscribe
- Mute
- Subscribe to RSS Feed
- Permalink
- Notify Moderator
Feb 20, 2014
05:43 AM
- Mark as New
- Bookmark
- Subscribe
- Mute
- Subscribe to RSS Feed
- Permalink
- Notify Moderator
Feb 20, 2014
05:43 AM
Werner
What does the function f(p,bd) do? I think I get the other 3
Regards
JXB
Feb 20, 2014
06:17 AM
- Mark as New
- Bookmark
- Subscribe
- Mute
- Subscribe to RSS Feed
- Permalink
- Notify Moderator
Feb 20, 2014
06:17 AM
it's some kind of example!
Managed to have the "bounding" curves as a function of the ratio b/d. Your proposed interpolation function seems to return a "correct" estimated K value for a given ratio b/d and py/M value. See attached
Need to see now if I can incorporate the csinterp_2D functions in the iterative function
Thanks
Regards
JXB
Feb 20, 2014
06:51 AM
- Mark as New
- Bookmark
- Subscribe
- Mute
- Subscribe to RSS Feed
- Permalink
- Notify Moderator
Feb 20, 2014
06:51 AM
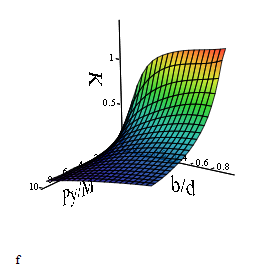
What does the function f(p,bd) do?
Thats the 2D interpolation, You have a rectangualar data table wher you can look up a K-value for given py/M and b/d. The function f does exactly this but it interpolates inbetween the given values. Maybe I should have called it K() instead of f(). First parameter b is the ratio b/d, second parameter p is the ratio py/M. f() basically is a 2D-surface (see picture below) and the curves you are drawing are slices of that surface for constant values of b/d. So I can use f() to create those functions bdxxx(p) which show the K-values for varying py/M and constant b/d.
Feb 20, 2014
09:24 AM
- Mark as New
- Bookmark
- Subscribe
- Mute
- Subscribe to RSS Feed
- Permalink
- Notify Moderator
Feb 20, 2014
09:24 AM
Werner
Thanks for the clarification. I think I am getting there
I have now the program to calculate the value Mmax by 1st interpolating for K. It seems that the loop does not quite converge to the expected answer.
I expect K to be close to 0.44 (and therefore indirectly Mmax close to 12870) but the program seems to converge to K=0.451. There must be something in the interpolation maybe
Regards
JXB
Feb 20, 2014
11:07 AM
- Mark as New
- Bookmark
- Subscribe
- Mute
- Subscribe to RSS Feed
- Permalink
- Notify Moderator
Feb 20, 2014
11:07 AM
Haven't looked at the file and not at what the goal of your iteration would be, but splined tend to be "wavy" and sometimes its better to use simple linear interpolation.
Feb 20, 2014
11:33 AM
- Mark as New
- Bookmark
- Subscribe
- Mute
- Subscribe to RSS Feed
- Permalink
- Notify Moderator
Feb 20, 2014
11:33 AM
test with the linterp in function GetMmax give indeed slight different results
with linterp_2D nb of iteration n = 18, K final =0.451
with csinterp_2D nb of interatin n= 18, K final = 0.456
a plot of the K value for each iteration doe shows some "wavyness"
Feb 20, 2014
01:45 PM
- Mark as New
- Bookmark
- Subscribe
- Mute
- Subscribe to RSS Feed
- Permalink
- Notify Moderator
Feb 20, 2014
01:45 PM
The values you calculated are correct and they are more precise as those given in the reference (they are rounded to 2 decimals after every step). Nevertheless there is an error in your calculation which leads to this "wavyness" (which is not due to the splines). The error is the in the calculation of PyM you should use Mmax[i and NOT Mmax[i-1. Chnage that and you get a continous approximation.
Find attached a slighty modified routine.
Feb 20, 2014
02:17 PM
- Mark as New
- Bookmark
- Subscribe
- Mute
- Subscribe to RSS Feed
- Permalink
- Notify Moderator
Feb 20, 2014
02:17 PM
Thanks a lot for that. Much appreciated. I changed the espilon value to K[i- K[i-1. Convergence is quicker as K value is smaller

