
Turn on suggestions
Auto-suggest helps you quickly narrow down your search results by suggesting possible matches as you type.
Showing results for
Turn on suggestions
Auto-suggest helps you quickly narrow down your search results by suggesting possible matches as you type.
Showing results for
Options
- Subscribe to RSS Feed
- Mark Topic as New
- Mark Topic as Read
- Float this Topic for Current User
- Bookmark
- Subscribe
- Mute
- Printer Friendly Page
Plot a function with a vector as its input variable
Apr 02, 2014
08:42 AM
- Mark as New
- Bookmark
- Subscribe
- Mute
- Subscribe to RSS Feed
- Permalink
- Notify Moderator
Apr 02, 2014
08:42 AM
Plot a function with a vector as its input variable
Hi,
I would like to plot a function, say y(x), that depends on x and another independent variable, say a vector ab that has the same size as x. The equation looks like this:
y(x): x +ab;
I have made a simple plot in the attached worksheet. Anybody can lend a helping hand?
Bests,
Newin
Labels:
- Labels:
-
Other
31 REPLIES 31
Apr 02, 2014
08:59 AM
- Mark as New
- Bookmark
- Subscribe
- Mute
- Subscribe to RSS Feed
- Permalink
- Notify Moderator
Apr 02, 2014
10:02 AM
- Mark as New
- Bookmark
- Subscribe
- Mute
- Subscribe to RSS Feed
- Permalink
- Notify Moderator
Apr 02, 2014
10:02 AM
Hi Alan,
Many thanks! But what if x can't be expressed as a linear function of c (or last(ab))? For example it x is not equally spaced? The only condition I have is that for each value of x there is a particular value of ab.
Newin
Apr 02, 2014
10:11 AM
- Mark as New
- Bookmark
- Subscribe
- Mute
- Subscribe to RSS Feed
- Permalink
- Notify Moderator
Apr 02, 2014
10:11 AM
new jap wrote:
Hi Alan,
Many thanks! But what if x can't be expressed as a linear function of c (or last(ab))? For example it x is not equally spaced? The only condition I have is that for each value of x there is a particular value of ab.
Newin
I didn't suggest the relationship was a linear function - just some, possibly incredibly complicated, function. But, it doesn't really matter; as long as you have the values you can do the plotting!
Alan
Apr 02, 2014
10:12 AM
- Mark as New
- Bookmark
- Subscribe
- Mute
- Subscribe to RSS Feed
- Permalink
- Notify Moderator
Apr 02, 2014
10:12 AM
x has to be a vector, not a range variable to make this work.
Guess you could use vectorization to advantage here.
Look if the attached helps.
Apr 02, 2014
10:15 AM
- Mark as New
- Bookmark
- Subscribe
- Mute
- Subscribe to RSS Feed
- Permalink
- Notify Moderator
Apr 02, 2014
10:15 AM
Loving that trick with the range variable.
Apr 02, 2014
10:31 AM
- Mark as New
- Bookmark
- Subscribe
- Mute
- Subscribe to RSS Feed
- Permalink
- Notify Moderator
Apr 02, 2014
10:31 AM
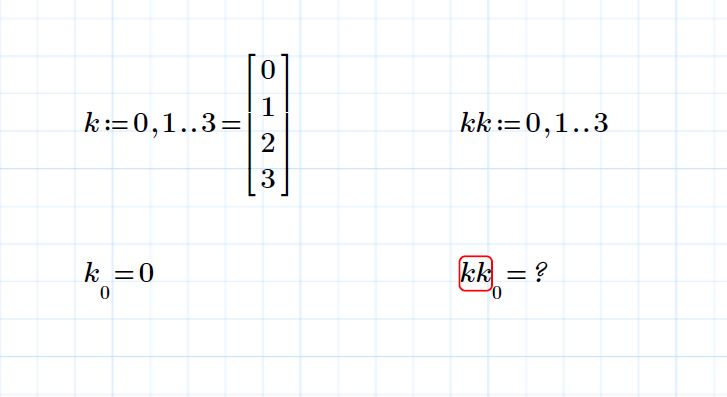
Yes, its cute. But as to best of my knowledge its undocumented (I learned about it here in this forum, where else?) there is no guarantee it will work in future versions the same way. Also it may not work in older MC versions as inline evaluation was introduced rather late.
The distinction between range and vector has always caused confusion. I wish we could use just one for everything like in SMath. Backward compatibility might be the problem here but then, maybe even not.
Apr 02, 2014
10:42 AM
- Mark as New
- Bookmark
- Subscribe
- Mute
- Subscribe to RSS Feed
- Permalink
- Notify Moderator
Apr 02, 2014
10:42 AM
A quick check in Prime and it works.
I wish we could use just one for everything like in SMath. Backward compatibility might be the problem here but then, maybe even not.
I have to agree. It took me a while to get my head around the difference in behavior.
Apr 02, 2014
10:35 AM
- Mark as New
- Bookmark
- Subscribe
- Mute
- Subscribe to RSS Feed
- Permalink
- Notify Moderator
Apr 02, 2014
10:35 AM
Hi Alan, I think I am too dumb but I just can't see that directly; I just didn't know how to link the index both x and ab, i.e. x(3) with ab(3) and x(4) with ab(4) for instance, and not having x to depend on the index itself. Anyway, what Werner Exinger suggested addresses exactly what I am looking for. It is also interesting to learn how to create a function to generate an equally spaced array!
Many thanks to you both!
Newin
Apr 02, 2014
10:45 AM
- Mark as New
- Bookmark
- Subscribe
- Mute
- Subscribe to RSS Feed
- Permalink
- Notify Moderator
Apr 02, 2014
10:45 AM
It is also interesting to learn how to create a function to generate an equally spaced array!
Tow more self defined functions in the attached which may be of use.
Apr 02, 2014
10:58 AM
- Mark as New
- Bookmark
- Subscribe
- Mute
- Subscribe to RSS Feed
- Permalink
- Notify Moderator
Apr 02, 2014
10:58 AM
Alans way of doing it is basically just the same, but he uses a range variable to link the correct elements of x and ab together rather than relying on MC doing it right or using vectorization.
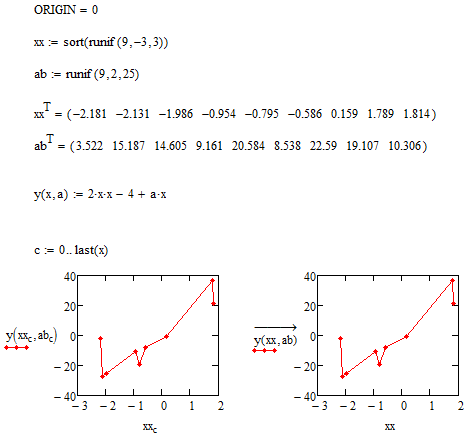
Both Alan and me have used similar methods to create a vector x based on the range you provided. Of course in both sheets x can be any vector you like, as long as the dimensions of x and ab are the same. For Alans sheet you simply have to provide a range variable c to count the vector elelements.Guess its a matter of personal taste if you use a range or rather vectorization. It may also be dependent on for whom the document is made for and if that person is more likely to understand whats going on with the range or the (maybe not that obvious) vectorization.
Anyway, here is an example which uses random values for both x and a and you see both methods side by side. Note that I used a*x anmd also x*x instead of x^2, so vectorization is mandatory.
Apr 02, 2014
11:24 AM
- Mark as New
- Bookmark
- Subscribe
- Mute
- Subscribe to RSS Feed
- Permalink
- Notify Moderator
Apr 02, 2014
11:24 AM
Hi Mike, many thanks and I am sure I will find them very useful!
Hi Werner, I tried to replace xx with a range variable but it doesn't seem to work. I attached here the worksheet. I also tried the way Alan did with x_c: -2+4*c/n, but also this does not result in a matrix that is required by T. So, it seems to me that we need a matrix or a vector and a range variable will not work. Am I missing something?
You all really make me starting to love Mathcad now. It seems to be a really nice tool, and I hope I could devote more time on it.
Cheers,
Newin
Apr 02, 2014
11:41 AM
- Mark as New
- Bookmark
- Subscribe
- Mute
- Subscribe to RSS Feed
- Permalink
- Notify Moderator
Apr 02, 2014
11:41 AM
Hi Werner, I tried to replace xx with a range variable but it doesn't seem to work.
Correct!
That was the point of the postings so far - you need a vector, it doesn't work with a range. Think I have written that explicitely in my first reply here.
Ranges are implicit for-loops and should be used for indexing vectors and matrices, provide abscissa values for plotting and can be use in programmed for-loops - nothing else!
If you turn your range into a vector it will have the wrong dimension, as it will have 10 elements as opposed to 9 in ab. Here you would see the advantage of Alan's method as it would still work, simply ignoring the 10th element 😉
Here is a link to get you more familiar to the subject vector vs. range. Its an old pitfall.
Apr 02, 2014
12:05 PM
- Mark as New
- Bookmark
- Subscribe
- Mute
- Subscribe to RSS Feed
- Permalink
- Notify Moderator
Apr 02, 2014
12:05 PM
Hi Werner,
Thanks! it's clearer to me now. By the way, I think you might have forgotten the link 
Newin
Apr 02, 2014
01:08 PM
- Mark as New
- Bookmark
- Subscribe
- Mute
- Subscribe to RSS Feed
- Permalink
- Notify Moderator
Apr 02, 2014
01:08 PM
Following on from Werners explanantion the attached may be of some use.
Apr 02, 2014
01:11 PM
- Mark as New
- Bookmark
- Subscribe
- Mute
- Subscribe to RSS Feed
- Permalink
- Notify Moderator
Apr 02, 2014
01:11 PM
Oh, I forgot to add this one.
Apr 02, 2014
02:32 PM
- Mark as New
- Bookmark
- Subscribe
- Mute
- Subscribe to RSS Feed
- Permalink
- Notify Moderator
Apr 02, 2014
02:32 PM
Mike Armstrong wrote:
Oh, I forgot to add this one.
Yes, thats the article I linked to in pdf format.
Meanwhile I found Stuart's second treatise which was published a month later in my collection and for the completeness sake I attach both and also a combined pdf of them..
Its a shame those goodies are no longer available at PTC's site or least I am not able to find them on that horrible to navigate site.
Apr 02, 2014
04:42 PM
- Mark as New
- Bookmark
- Subscribe
- Mute
- Subscribe to RSS Feed
- Permalink
- Notify Moderator
Apr 02, 2014
04:42 PM
Cheers Werner good find.
Apr 02, 2014
04:48 PM
- Mark as New
- Bookmark
- Subscribe
- Mute
- Subscribe to RSS Feed
- Permalink
- Notify Moderator
Apr 02, 2014
04:48 PM
Its a shame those goodies are no longer available at PTC's site or least I am not able to find them on that horrible to navigate site.
It is a shame. We lost so much information when the forum was migrated over.
Apr 02, 2014
02:23 PM
- Mark as New
- Bookmark
- Subscribe
- Mute
- Subscribe to RSS Feed
- Permalink
- Notify Moderator
Apr 02, 2014
02:23 PM
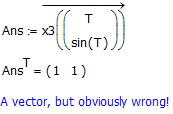
Obviously wrong? Why? The answer is exactly what I would have expected (after some thinking about it, I admit ;-). Vectorizing is not recursively digging in nested vectors but would vectorize the first/outer vector only, which is the 2x1 argument vector containing the larger vectors T and sin(T) as elements. So as the vector contains 2 elements, also the output would consist of just two elements. Every element is fed into x3 and the function (which expects a vector argument anyway) is evaluated. The result is the vector (1,1), as for both, T and sin(T), the second element is smaller than 0.2 and so the function x3 returns true (=1).
Apr 02, 2014
04:49 PM
- Mark as New
- Bookmark
- Subscribe
- Mute
- Subscribe to RSS Feed
- Permalink
- Notify Moderator
Apr 02, 2014
04:49 PM
Consider that a bug?
Apr 02, 2014
05:31 PM
- Mark as New
- Bookmark
- Subscribe
- Mute
- Subscribe to RSS Feed
- Permalink
- Notify Moderator
Apr 02, 2014
05:31 PM
Mike Armstrong wrote:
Consider that a bug?
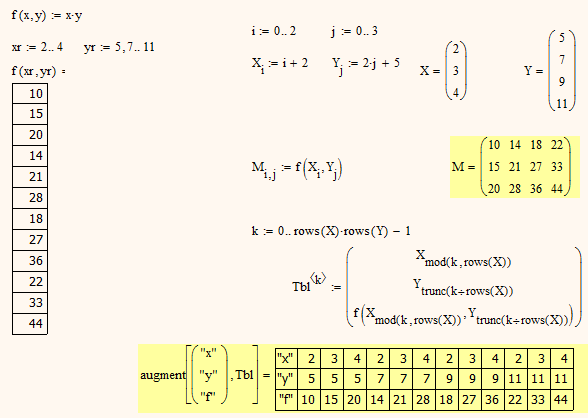
No. What exactly do you mean that is a bug? The result we see in the example you posted is exactly as it should be IMHO. Its no bug that MC doesn't go into nested vectors. I don't think that would be practical and I wouldn't want it to do that. Vectorization is a powerful operator but it can't solve all problems. E.g. it often is necessary to evaluate a function with every combination out of 2 different vectors. We can see how the result should look by using range variables (sic!) but the result can't be assigned to a variable and so isn't useful.
To make it useable for further calculations we can't use vectorization either so we will have to build our tables using range variables for indexing the vectors or using a small program.
So, no, I don't consider the implemenation of the vectorize operator as a bug, I just wish we would not have to distinguish between ranges and vectors and could use only one (vector) for both as in SMath.
Apr 03, 2014
02:18 AM
- Mark as New
- Bookmark
- Subscribe
- Mute
- Subscribe to RSS Feed
- Permalink
- Notify Moderator
Apr 03, 2014
02:18 AM
Werner Exinger wrote:
Mike Armstrong wrote:
Consider that a bug?
No. What exactly do you mean that is a bug?
I never stated it was a bug, mearly a question to yourself.
Nice example by the way.
Apr 02, 2014
02:06 PM
- Mark as New
- Bookmark
- Subscribe
- Mute
- Subscribe to RSS Feed
- Permalink
- Notify Moderator
Apr 02, 2014
02:06 PM
By the way, I think you might have forgotten the link
Correct, here it is: http://www.ptc.com/WCMS/files/131949/en/Range_Variables_Vs._Vectors_in_Mathcad.pdf
AFAIK Stuart had written two essays on the subject but at the moment I am not able to find the second one.
Apr 03, 2014
12:45 PM
- Mark as New
- Bookmark
- Subscribe
- Mute
- Subscribe to RSS Feed
- Permalink
- Notify Moderator
Apr 03, 2014
12:45 PM
Many thanks Werner, I shall look into that!
Newin
Apr 03, 2014
12:52 PM
- Mark as New
- Bookmark
- Subscribe
- Mute
- Subscribe to RSS Feed
- Permalink
- Notify Moderator
Apr 03, 2014
12:52 PM
Many thanks also Mike for your worksheets. I am new here, and also buried under other work, so will take me sometime to get around and play with your files. But I will sure find them useful!
Newin
Apr 03, 2014
01:52 PM
- Mark as New
- Bookmark
- Subscribe
- Mute
- Subscribe to RSS Feed
- Permalink
- Notify Moderator
Apr 03, 2014
01:52 PM
Don't overlook the secon file above: http://communities.ptc.com/message/238888#238888
Apr 04, 2014
04:35 AM
- Mark as New
- Bookmark
- Subscribe
- Mute
- Subscribe to RSS Feed
- Permalink
- Notify Moderator
Apr 04, 2014
04:35 AM
Hi all,
I have been trying to plot a function as attached. Everything seems fine, but the plot function gives error. Could you have a look what I have done wrong here?
I attached along with the worksheet the two input data files that I used.
Newin
Apr 04, 2014
04:41 AM
- Mark as New
- Bookmark
- Subscribe
- Mute
- Subscribe to RSS Feed
- Permalink
- Notify Moderator
Apr 04, 2014
04:41 AM
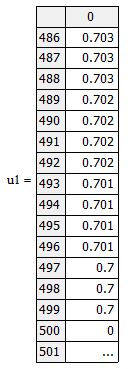
u1 contains zero's.
Apr 04, 2014
04:47 AM
- Mark as New
- Bookmark
- Subscribe
- Mute
- Subscribe to RSS Feed
- Permalink
- Notify Moderator

