
Turn on suggestions
Auto-suggest helps you quickly narrow down your search results by suggesting possible matches as you type.
Showing results for
Turn on suggestions
Auto-suggest helps you quickly narrow down your search results by suggesting possible matches as you type.
Showing results for
Community Tip - Did you get called away in the middle of writing a post? Don't worry you can find your unfinished post later in the Drafts section of your profile page. X
Options
- Subscribe to RSS Feed
- Mark Topic as New
- Mark Topic as Read
- Float this Topic for Current User
- Bookmark
- Subscribe
- Mute
- Printer Friendly Page
Pi Day Fun Facts with PTC Mathcad
Mar 17, 2017
07:18 AM
- Mark as New
- Bookmark
- Subscribe
- Mute
- Subscribe to RSS Feed
- Permalink
- Notify Moderator
Mar 17, 2017
07:18 AM
Pi Day Fun Facts with PTC Mathcad
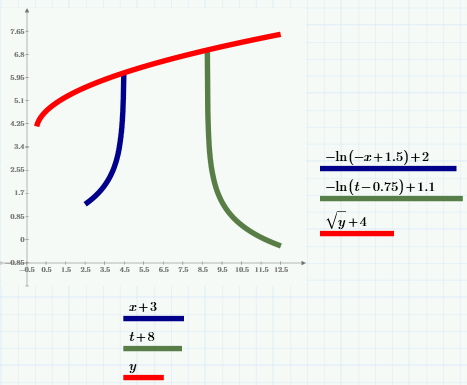
When i set the formula to "-In(t-0.75)+1.6", the green line will beyond the red line.
Why my Pi graph is "-In(t-0.75)+1.1", not like the PTC Mathcad official graph shown in the following second picture?
http://www.ptc.com/mathcad-software-blog/pi-day

Solved! Go to Solution.
Labels:
- Labels:
-
Other
1 ACCEPTED SOLUTION
Accepted Solutions
Mar 17, 2017
10:38 AM
- Mark as New
- Bookmark
- Subscribe
- Mute
- Subscribe to RSS Feed
- Permalink
- Notify Moderator
Mar 17, 2017
10:38 AM
Perhaps they cheated and used Photoshop. PTC contributing to unrealistic image standards.
2 REPLIES 2
Mar 17, 2017
10:38 AM
- Mark as New
- Bookmark
- Subscribe
- Mute
- Subscribe to RSS Feed
- Permalink
- Notify Moderator
Mar 17, 2017
10:38 AM
Perhaps they cheated and used Photoshop. PTC contributing to unrealistic image standards.
Mar 17, 2017
11:49 AM
- Mark as New
- Bookmark
- Subscribe
- Mute
- Subscribe to RSS Feed
- Permalink
- Notify Moderator
Mar 17, 2017
11:49 AM
Probably they have changed the way how the abscissa values are chosen in a quickplot when they moved from P31 to P40.
Experiment with a range varable for t and different step values

